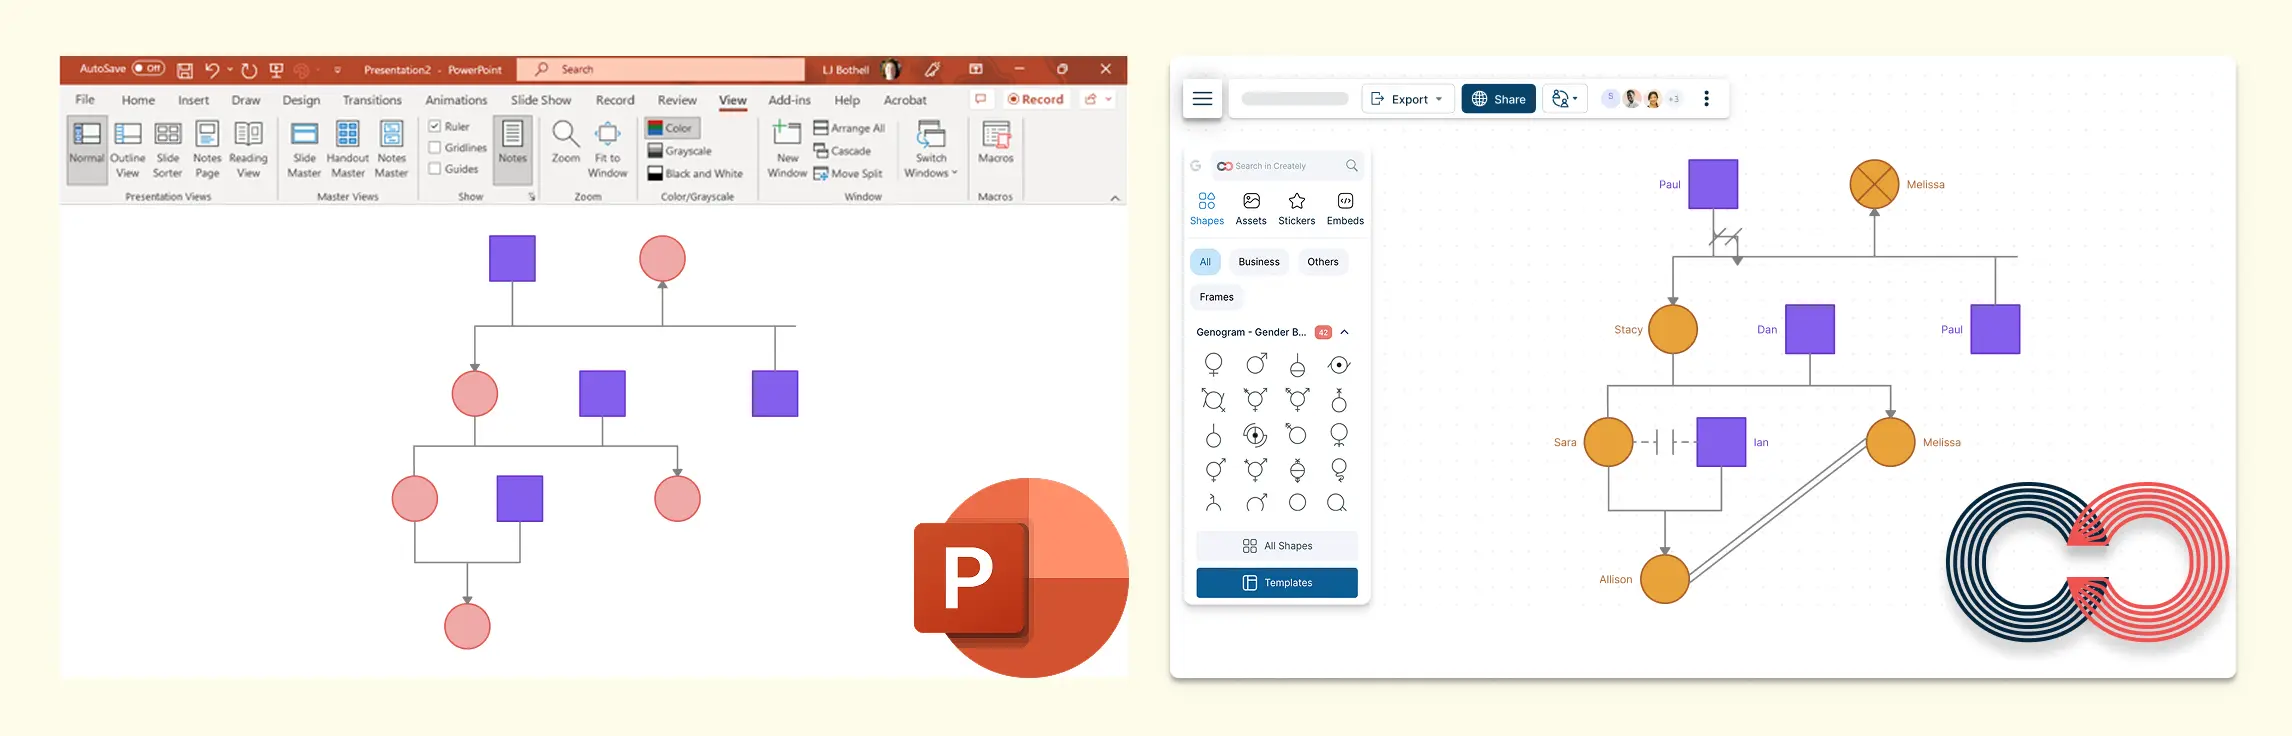
Frustrated with the limitations of PowerPoint for genogram creation? You’re not alone. While PowerPoint is a go-to tool for presentations, it falls short when it comes to creating detailed genograms. The lack of specialized symbols, templates, and easy-to-use features makes it a challenge to build accurate and scalable family diagrams. In this guide, we’ll show you how to make a genogram in PowerPoint, highlight its limitations, and explain why Creately is a better alternative for creating professional, customizable, and easily editable genograms.
What Is a Genogram?
A genogram is a diagram that visually represents the relationships, patterns, and histories within a family or social group. Often referred to as a family tree, it goes beyond simple genealogy by showing detailed information such as medical history, emotional relationships, and behavioral patterns across generations. Genograms are commonly used in fields like family therapy, social work, psychology, and even career counseling to identify inherited traits, health conditions, and family dynamics.
Types of Genograms
There are several types of genograms, each serving different purposes. Here are some main types of genograms used:
- Family Genogram: This is the most common type, used to chart family relationships and genealogies, often highlighting important family events or relationships.
- Medical Genogram: Used to track medical histories across generations, this type of genogram can identify hereditary health conditions and patterns.
- Emotional Genogram: Focuses on the emotional relationships and interactions between family members, showing how emotions have influenced family dynamics.
- Career Genogram: This type traces the professional careers and work-related patterns within a family, helping to identify potential career influences or shared interests.
In PowerPoint, creating these various types of genograms requires manual input of symbols and careful arrangement of family members and relationships. On the other hand, Creately offers specialized templates and symbols for each genogram type, streamlining the process and making it easier to visualize complex patterns without the need for manual adjustments.
How to Make a Genogram in PowerPoint
Creating a genogram in PowerPoint can be done, but it requires time and effort due to the lack of specialized tools and templates. Here’s a step-by-step guide to help you get started.
Step 1. Open a New Presentation
- Start by opening PowerPoint and creating a new blank slide. Choose a blank layout to give you plenty of space to work with.
Step 2. Set Up the Slide
- Adjust the slide size if needed. Go to Design > Slide Size and select Custom Slide Size to set your preferred dimensions, especially if your genogram is going to be large.
Step 3. Add Shapes for Family Members
- Go to the Insert tab and click on Shapes to add rectangles or circles for each family member. Typically, squares represent men and circles represent women.
- Resize and arrange the shapes on the slide to begin forming your family tree.
Step 4. Insert Text to Label Family Members
- Click on each shape and type the name of the family member. You can also add additional details such as birthdates, medical information, or relationship notes, but this can quickly become cumbersome.
Step 5. Connect Family Members
- Use lines or arrows (found in Shapes) to represent relationships between family members. Straight lines are usually used for marriages, while dashed lines may represent estranged relationships or separations.
- You’ll need to manually adjust the lines to connect each family member correctly, which can become difficult to manage as your genogram grows larger.
Step 6. Add More Details and Relationships
- If you want to include more information, such as health history or emotional relationships, you’ll need to manually add text boxes and customize the symbols. PowerPoint doesn’t have pre-built genogram symbols, so this step requires a lot of manual work.
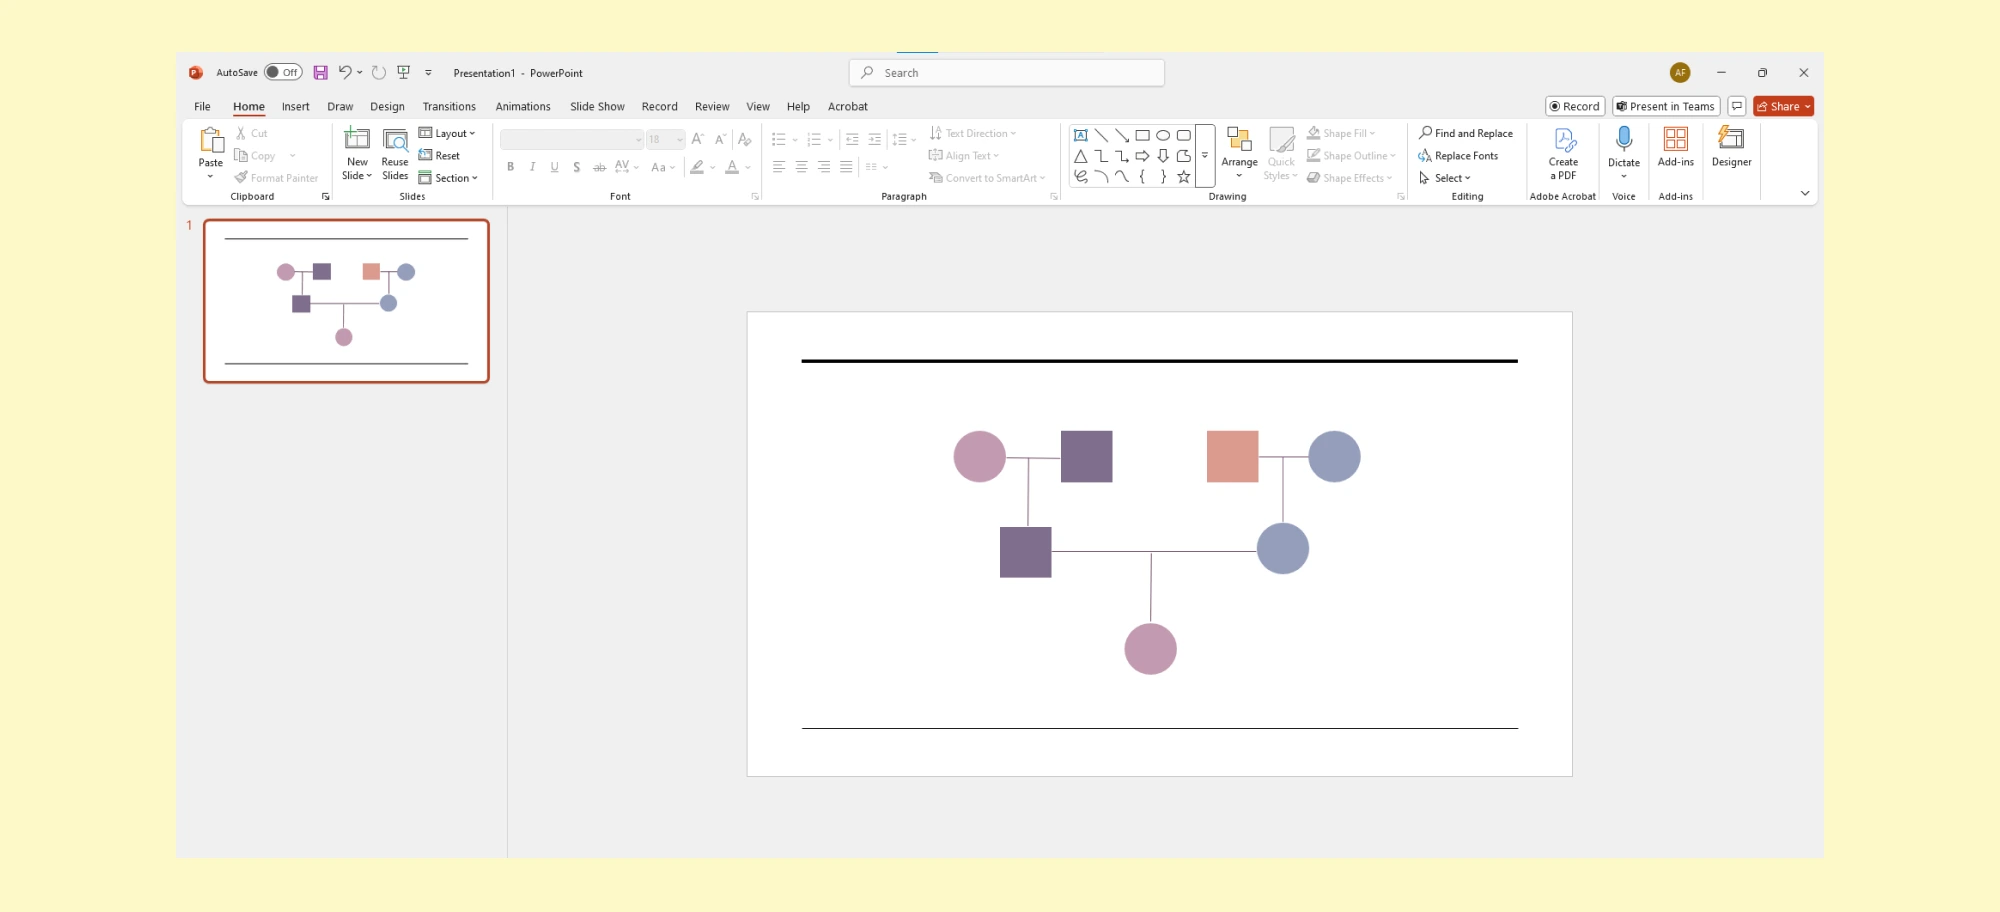
Step 7. Format the Genogram
- Once all your shapes and lines are in place, use PowerPoint’s formatting tools to change the colors, line thickness, and text formatting. This can help make the genogram more readable, though it might take time to get everything aligned properly.
Limitations of PowerPoint in Creating a Genogram
While PowerPoint can be used to create a basic genogram, it has several significant limitations that make the process tedious and inefficient, especially when compared to tools specifically designed for creating genograms.
❌ Lack of Specialized Genogram Symbols
PowerPoint does not come with built-in genogram symbols for representing family relationships, medical conditions, or emotional dynamics. You’ll have to manually create or import symbols, which can be time-consuming and lead to inconsistent designs.
❌ Manual Adjustment of Relationships
Connecting family members with lines or arrows in PowerPoint can become very challenging. Since there’s no automated layout feature for relationships, you’ll need to manually adjust lines and shapes, especially when dealing with multiple generations.
❌ Limited Template Options
PowerPoint doesn’t offer pre-built genogram templates. Every time you create a new genogram, you start from scratch, spending a significant amount of time setting up the layout and deciding on the design elements.
❌ Lack of Scalability
When working with large families or multiple generations, PowerPoint becomes less effective. The manual process of resizing and rearranging shapes and lines can make the genogram cluttered and hard to read.
❌ No Integration with Data or External Sources
PowerPoint doesn’t allow easy integration with external databases or data sources like health records or family history information. This means you’ll have to manually input all data, and updating the genogram with new information can be a cumbersome process.
❌ Limited Collaboration Features
PowerPoint is not designed for real-time collaboration. If you’re working on a genogram with multiple people, sharing and editing in real-time can be a slow and error-prone process.
❌ Tedious Customization for Complex Genograms
Adding and adjusting elements such as text boxes, shapes, and lines requires significant effort when you need to include a large amount of information or create detailed genograms with multiple layers of data.
Why Creately Is a Better Alternative to Create a Genogram in PowerPoint
Creately is designed specifically for creating genograms, making the entire process faster, more intuitive, and far less cumbersome. Here’s how Creately outshines PowerPoint when it comes to genogram creation:
✅ Ready-Made Genogram Templates
With Creately, you don’t need to start from scratch. It offers a variety of professionally designed genogram templates for different needs—whether you’re creating a family genogram, a medical chart, or tracking emotional relationships. These templates are fully customizable, saving you time while providing a clean, professional layout.
✅ Intuitive Drag-and-Drop Symbols
Unlike PowerPoint, where you need to manually draw and adjust each symbol, Creately makes it easy to add family members with its drag-and-drop feature. You can instantly add pre-designed symbols for different family members and connect them using relationship lines. This simple process ensures quick and accurate diagramming.
✅ Auto-Align and Relationship Lines
No more worrying about shapes shifting or misaligned connections. Creately has features to adjust and align elements, ensuring that as your genogram grows, everything stays organized. Relationship lines automatically snap into place, keeping the connections intact, even when you rearrange or scale the diagram.
✅ Add Custom Data Layers (Medical, Emotional, etc.)
Whether you’re documenting family health history, or tracking emotional connections, Creately allows you to easily layer additional data. Customize symbols and colors for different types of information—be it medical conditions, emotional relationships, or other variables—without cluttering the design.
✅ Real-Time Collaboration and Easy Sharing
Need to work with others on a genogram? Creately supports real-time collaboration, allowing multiple users to edit and comment simultaneously. Whether you’re collaborating with colleagues or working with clients, this feature eliminates version confusion and ensures seamless teamwork.
✅ Simple Export and Download Options
When you’re finished with your genogram, exporting is a breeze. Creately lets you download your work in various formats like PDF or PNG, and it’s also easy to share via a direct link. This is perfect for integrating your genogram into presentations, reports, or case studies, without the hassle of formatting.
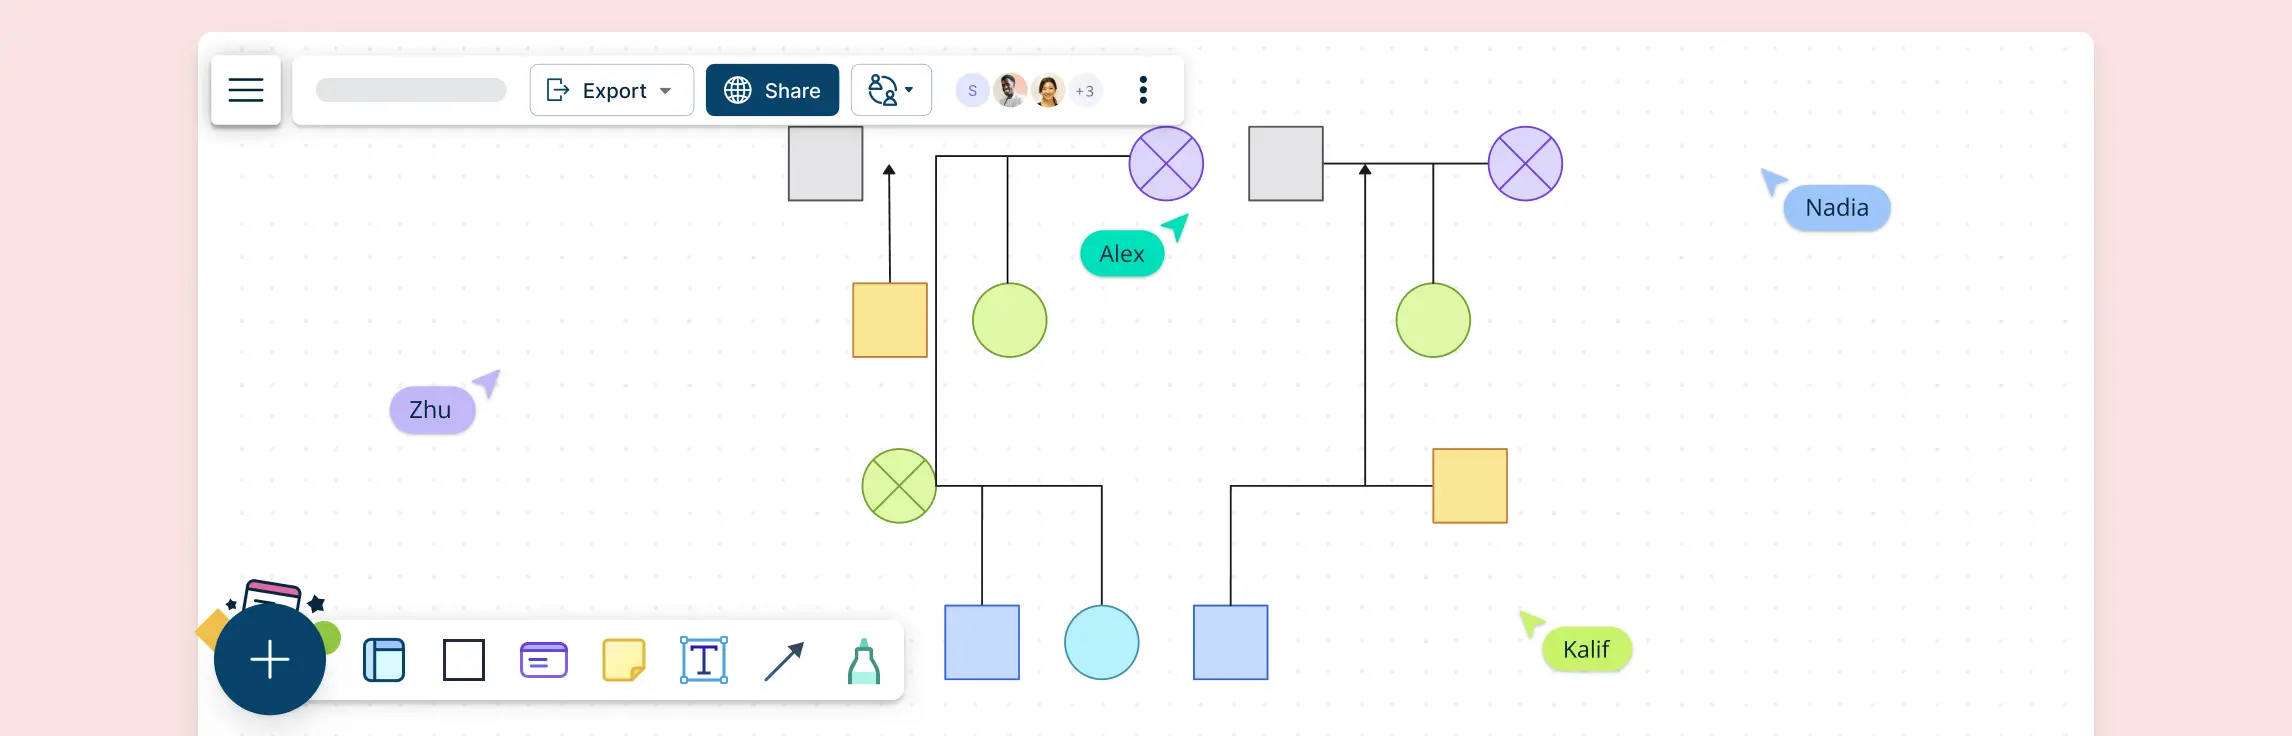
How to Make a Genogram with Creately
Creating a genogram with Creately is a smooth and efficient process, thanks to its intuitive interface and pre-built tools designed specifically for diagramming family structures and relationships. Follow this step-by-step guide to create your first genogram with Creately.
Step 1: Create a New Genogram Diagram
- Sign In or Sign Up: First, log into your Creately account (or create a new one if you don’t already have one).
- Start a New Workspace: From your dashboard, click on Create New Workspace and select Genogram from the available diagram options. Creately will automatically present you with a variety of templates to choose from.
Step 2: Choose a Template or Start from Scratch
- Use a Template: Creately offers a range of genogram templates for different purposes, such as family genograms, medical histories, and emotional relationship charts. Choose a template that closely matches your needs.
- Start from Scratch: If you prefer to build your genogram from the ground up, select a blank template and start adding family members and connections manually.
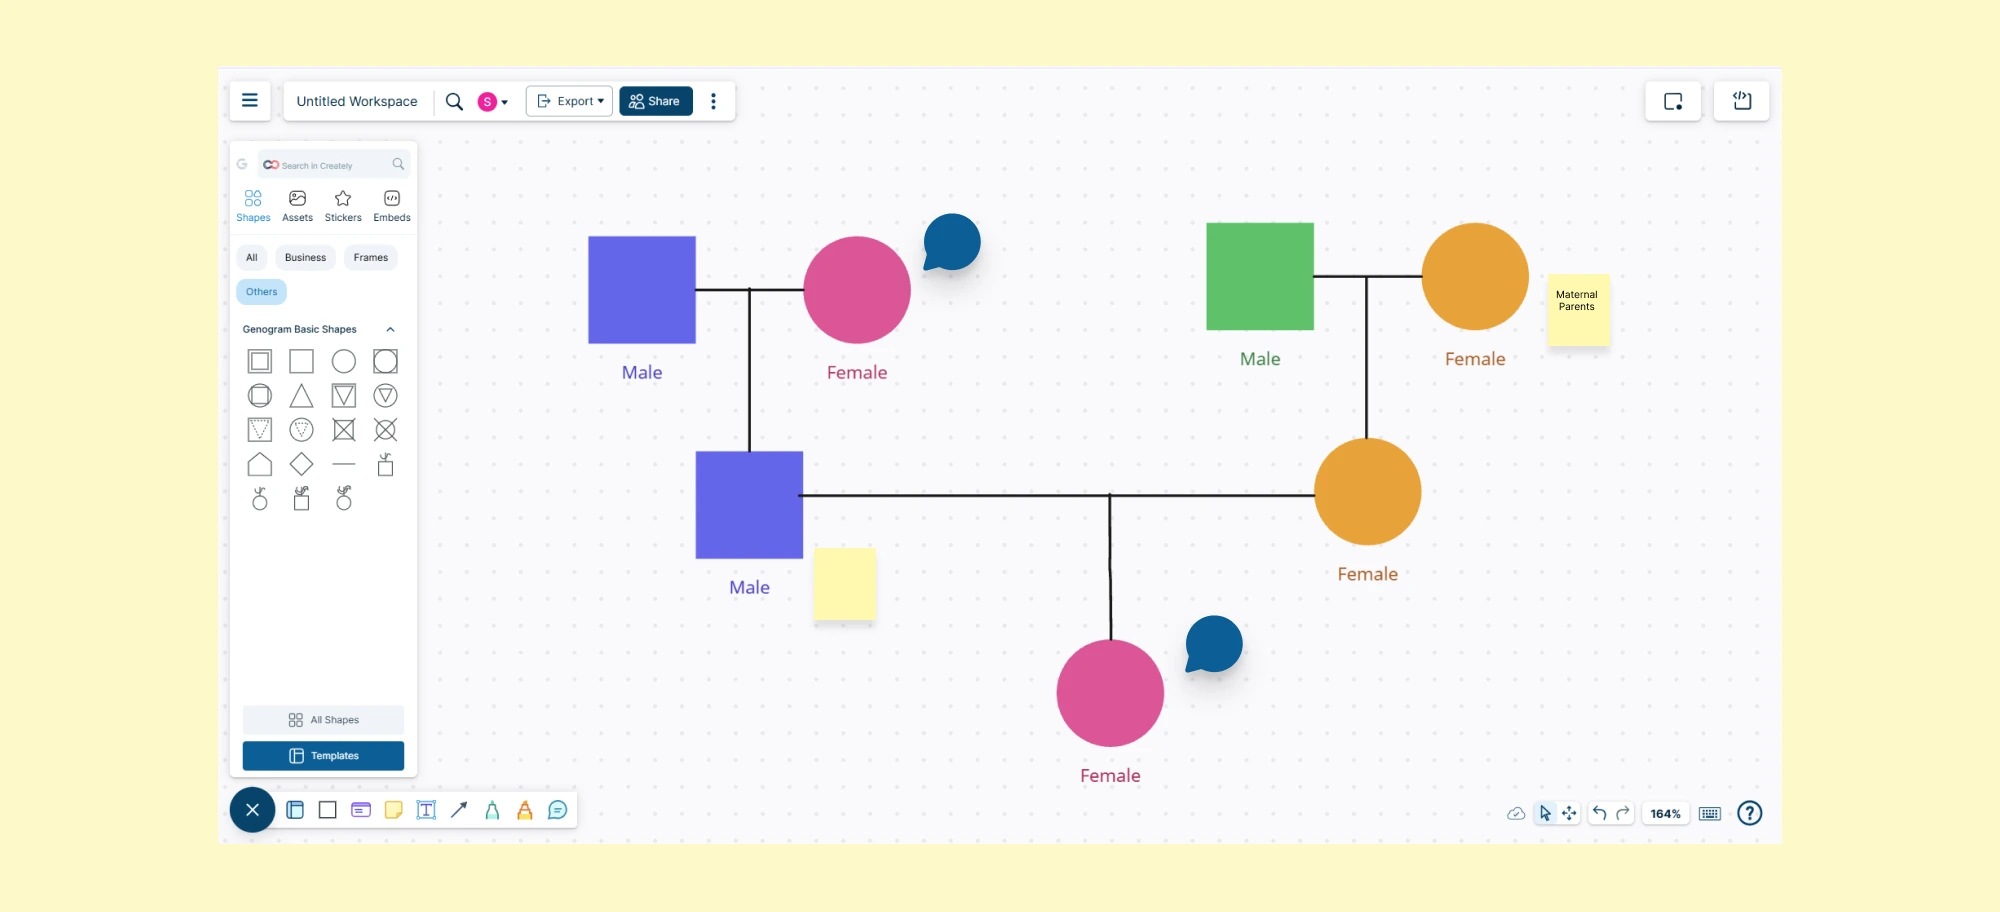
Step 3: Add Family Members
- Drag-and-Drop Symbols: Creately includes a comprehensive library of genogram symbols. To add family members, simply drag and drop the relevant symbols (e.g., circles for women, squares for men) onto the canvas.
- Label Family Members: Click on each symbol to label the family members. You can add details like names, birthdates, or other important information within the shapes.
Step 4: Connect Family Members
- Use Relationship Lines: To represent relationships, drag the appropriate lines (e.g., marriage, sibling, parent-child) from the symbols and connect them. These lines are automatically aligned and adjust themselves as you move the symbols around.
- Adjust Line Styles: Creately allows you to change the line style (e.g., solid, dashed) to represent different types of relationships (e.g., divorce, estranged, or close relationships).
Step 5: Add Additional Information
- Layer Data: Creately lets you layer additional data onto your genogram. For example, you can:
- Add medical information (such as health conditions) by clicking on a family member and choosing from predefined symbols for medical conditions.
- Add emotional relationships by using different colors or shapes to represent emotional ties between individuals.
- Customize Symbols and Text: Modify the appearance of symbols to fit your specific needs. You can change the shape, color, and size to ensure the genogram is both informative and visually appealing.
Step 6: Fine-Tune Your Layout
- Adjust Layout: As your genogram grows, align the elements and keep the layout clean. You can fine-tune the layout by manually adjusting the position of shapes and lines if necessary.
Step 7: Collaborate in Real-Time (Optional)
- Invite Collaborators: If you’re working with a team, invite colleagues or clients to collaborate on the genogram in real-time. Creately allows multiple users to edit the diagram simultaneously, which is especially useful in family therapy, social work, or medical settings.
- Add Comments: Collaborators can leave comments directly on the genogram, making feedback and revisions easy to track.
Step 8: Export or Share the Genogram
- Download: Once you’re satisfied with your genogram, click on Export to download your work in various formats such as PNG, PDF, or SVG.
- Share: You can also generate a shareable link to send to others or embed the genogram in presentations, reports, or other documents.
- Embed: If you need to present your genogram in a meeting or report, use Creately’s embed feature to directly add your diagram into PowerPoint, Google Docs, or any other tool that supports embedded visuals.
Step 9: Save and Update Your Genogram
- Automatic Saving: Creately automatically saves your work as you go, so you never have to worry about losing your progress.
- Updates: If you need to update the genogram in the future (e.g., adding new family members or health information), simply return to your diagram, make the necessary changes, and save the updated version.
Creating a genogram with Creately is a straightforward process, offering powerful tools for building detailed, professional diagrams. Whether you’re designing a family tree, tracking medical conditions, or mapping emotional relationships, Creately’s user-friendly interface, customization options, and real-time collaboration features make it a top choice over traditional tools like PowerPoint.
Genogram Examples Made with Creately
Creately makes it incredibly easy to create a variety of genograms that serve different purposes. Whether you’re building a family tree, documenting medical histories, or analyzing emotional relationships, Creately has many templates to suit your needs.
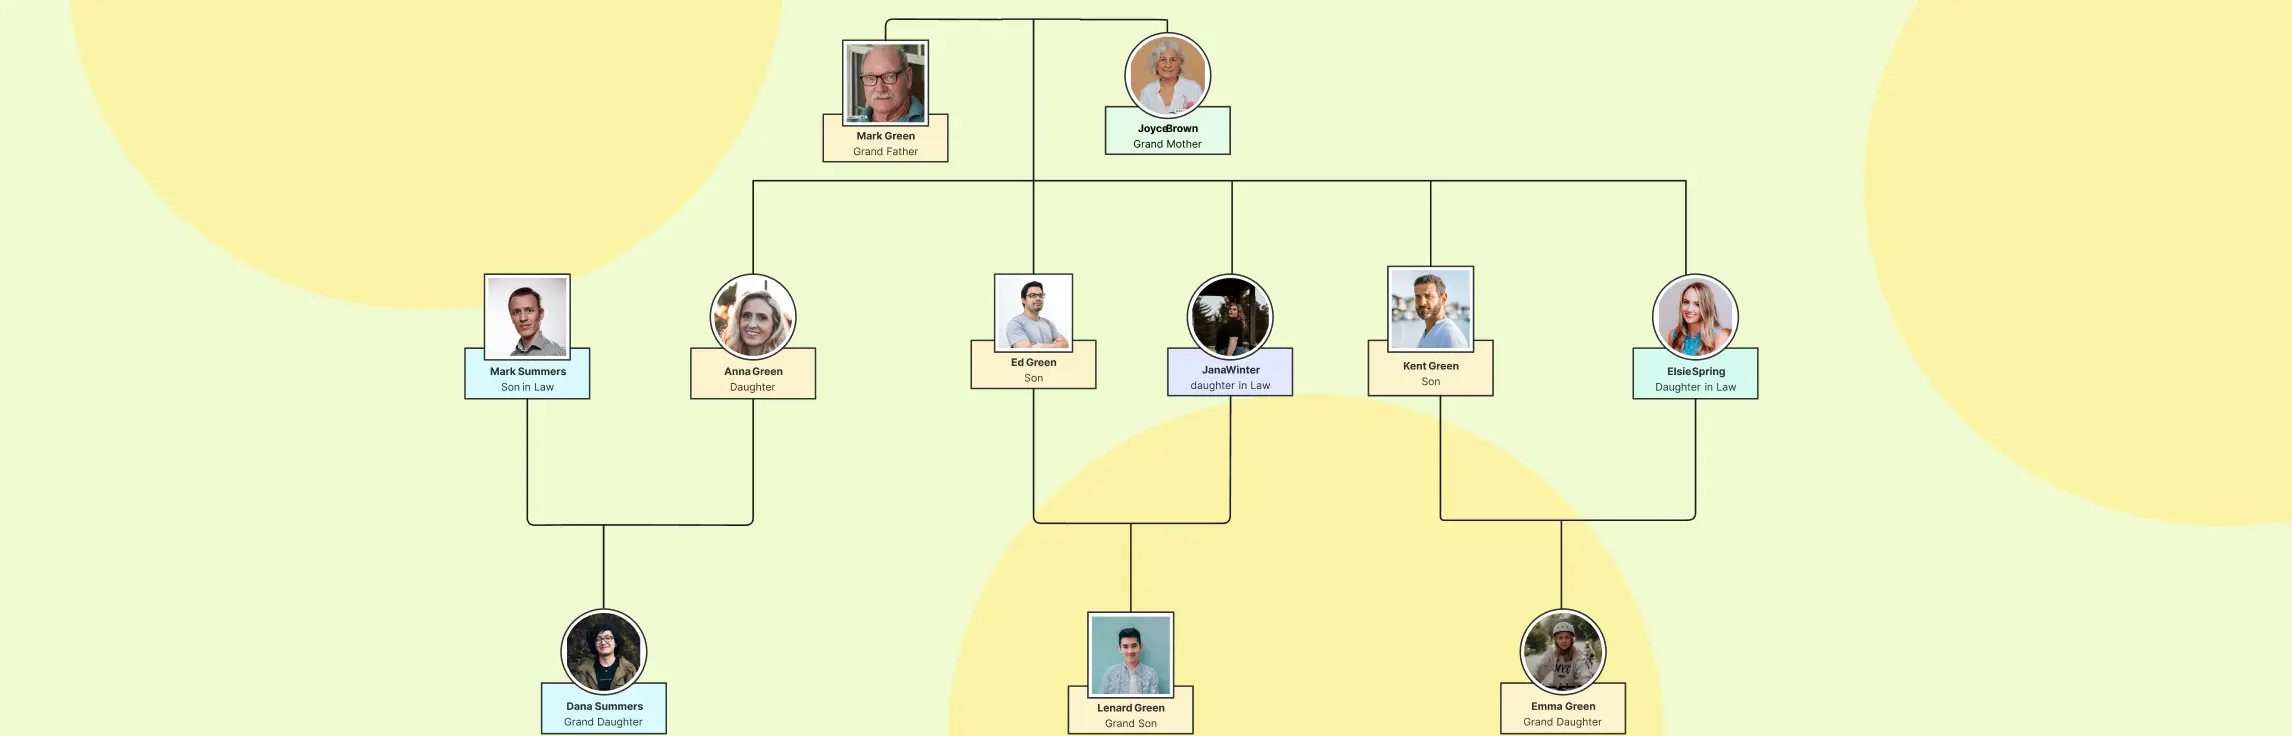
1. Family Genograms
A family genogram is one of the most common types, used to illustrate family relationships and genetic health patterns across multiple generations.


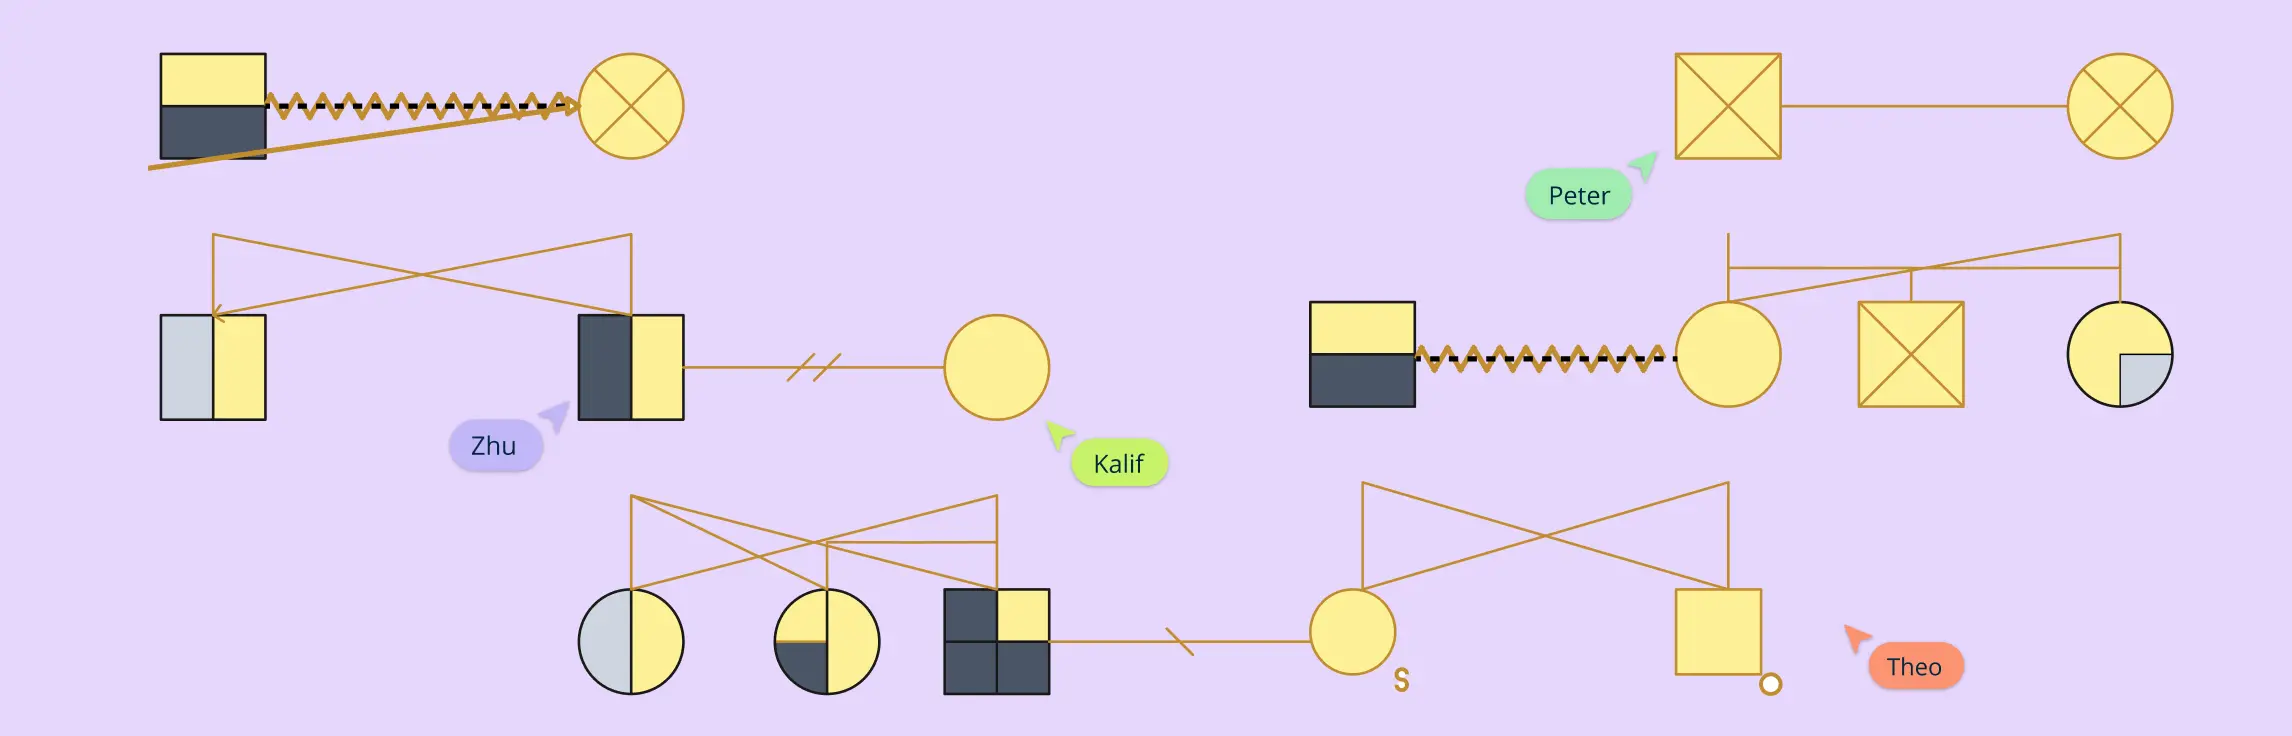
2. Medical Genograms
A medical genogram tracks hereditary conditions and health information within a family. This type of genogram is particularly helpful in healthcare settings, enabling doctors or healthcare professionals to quickly spot patterns of medical conditions within families.


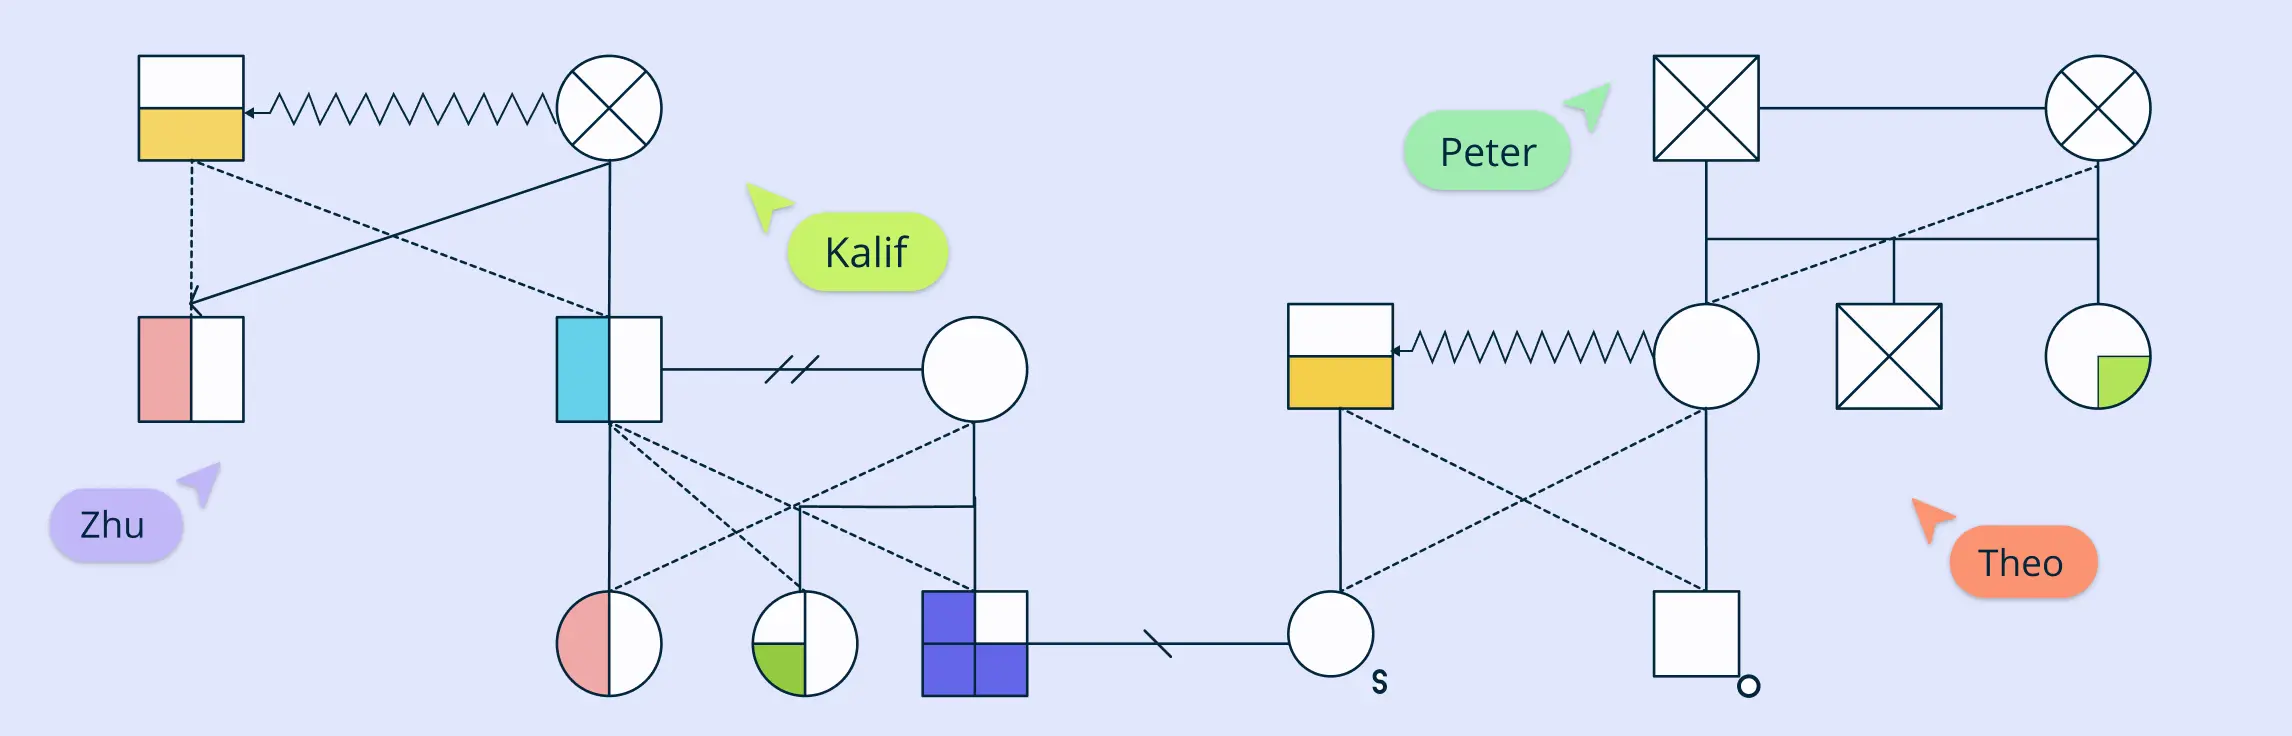
3. Emotional Relationship Genograms
An emotional relationship genogram maps out the emotional dynamics between family members, such as closeness, tension, and conflict. This type of genogram is useful in family therapy and social work.


Helpful Resources
Discover everything you need to know about genograms, from what they are, how to create a genogram, to how to understand what they mean.
Explore our collection of genogram templates.
Learn how different types of genograms can help visualize important aspects of life.
Explore the essential symbols used in genograms to represent everything from basic family structures to complex emotional and medical relationships.
Final Thoughts: Why Creately Is the Best Choice for Creating Genograms
Creately simplifies the genogram creation process with its intuitive tools, pre-built templates, and easy customization options, making it a far better choice than PowerPoint. Whether you’re mapping family relationships, medical history, or emotional dynamics, Creately streamlines the process and offers a professional, organized result. Say goodbye to the frustration of manual adjustments and misaligned shapes. Start with Creately today and experience how it makes creating clear, accurate genograms easier than ever.
FAQs on How to Create a Genogram in PowerPoint
Can I create a genogram in PowerPoint?
What are the limitations of making a genogram in PowerPoint?
Why is Creately a better tool for making genograms?
Resources:
Alexander, J.H., Callaghan, J.E.M. and Fellin, L.C. (2018). Genograms in research: participants’ reflections of the genogram process. Qualitative Research in Psychology, 19(1), pp.1–21. doi:https://doi.org/10.1080/14780887.2018.1545066.
Butler, J.F. (2008). The Family Diagram and Genogram: Comparisons and Contrasts. The American Journal of Family Therapy, 36(3), pp.169–180. doi:https://doi.org/10.1080/01926180701291055.
Puhlman, D., Shigeto, A., Murillo‐Borjas, G.A., Maurya, R.K. and Vincenti, V.B. (2023). Qualitative genogram analysis: A methodology for theorizing family dynamics. Journal of Family Theory & Review, 15(2), pp.276–291. doi:https://doi.org/10.1111/jftr.12496.