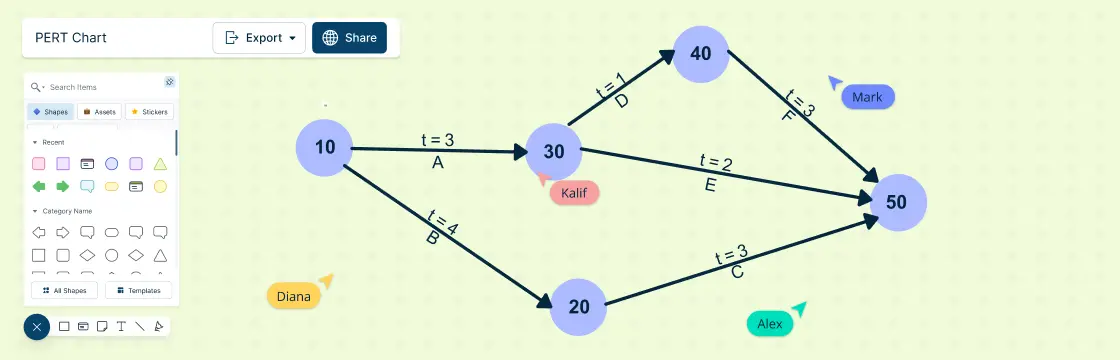
A PERT chart is a graphical tool that helps you visualize the tasks, dependencies, and milestones of your project. In this blog post, we’ll explain what a PERT chart is, how it originated, what it can be used for.
A PERT chart is a graphical tool that helps you visualize the tasks, dependencies, and milestones of your project. In this blog post, we’ll explain what a PERT chart is, how it originated, what it can be used for.
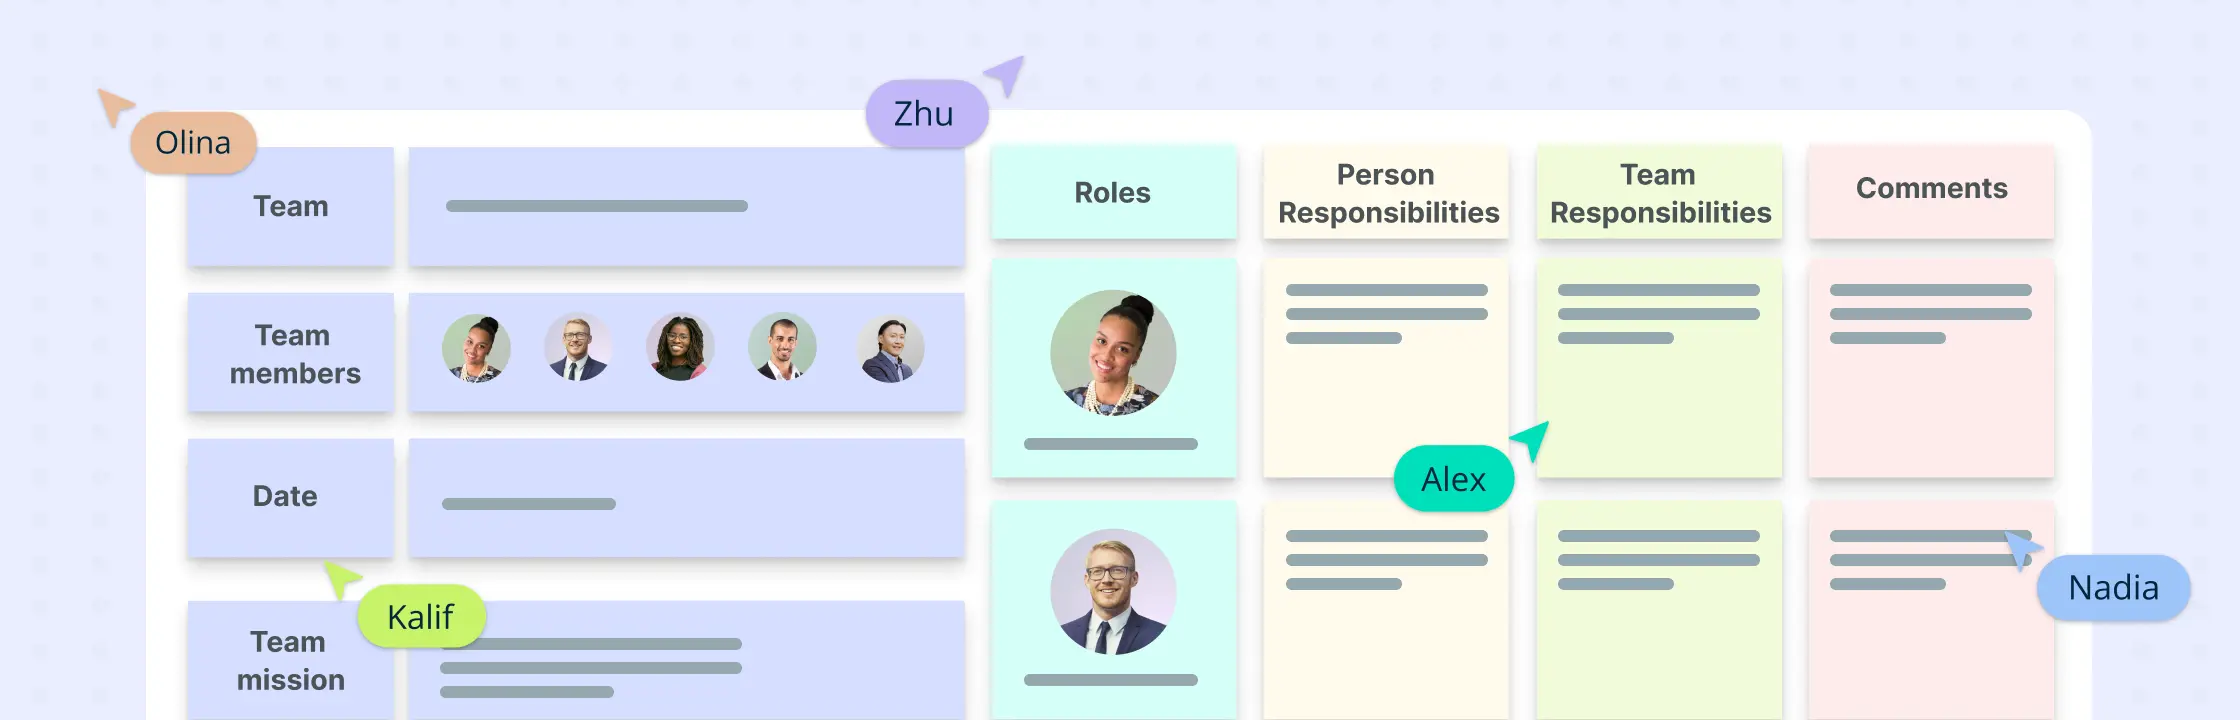
Trying to accomplish a collective goal without clearly defined roles and responsibilities is like sailing a ship with a captain or crew.
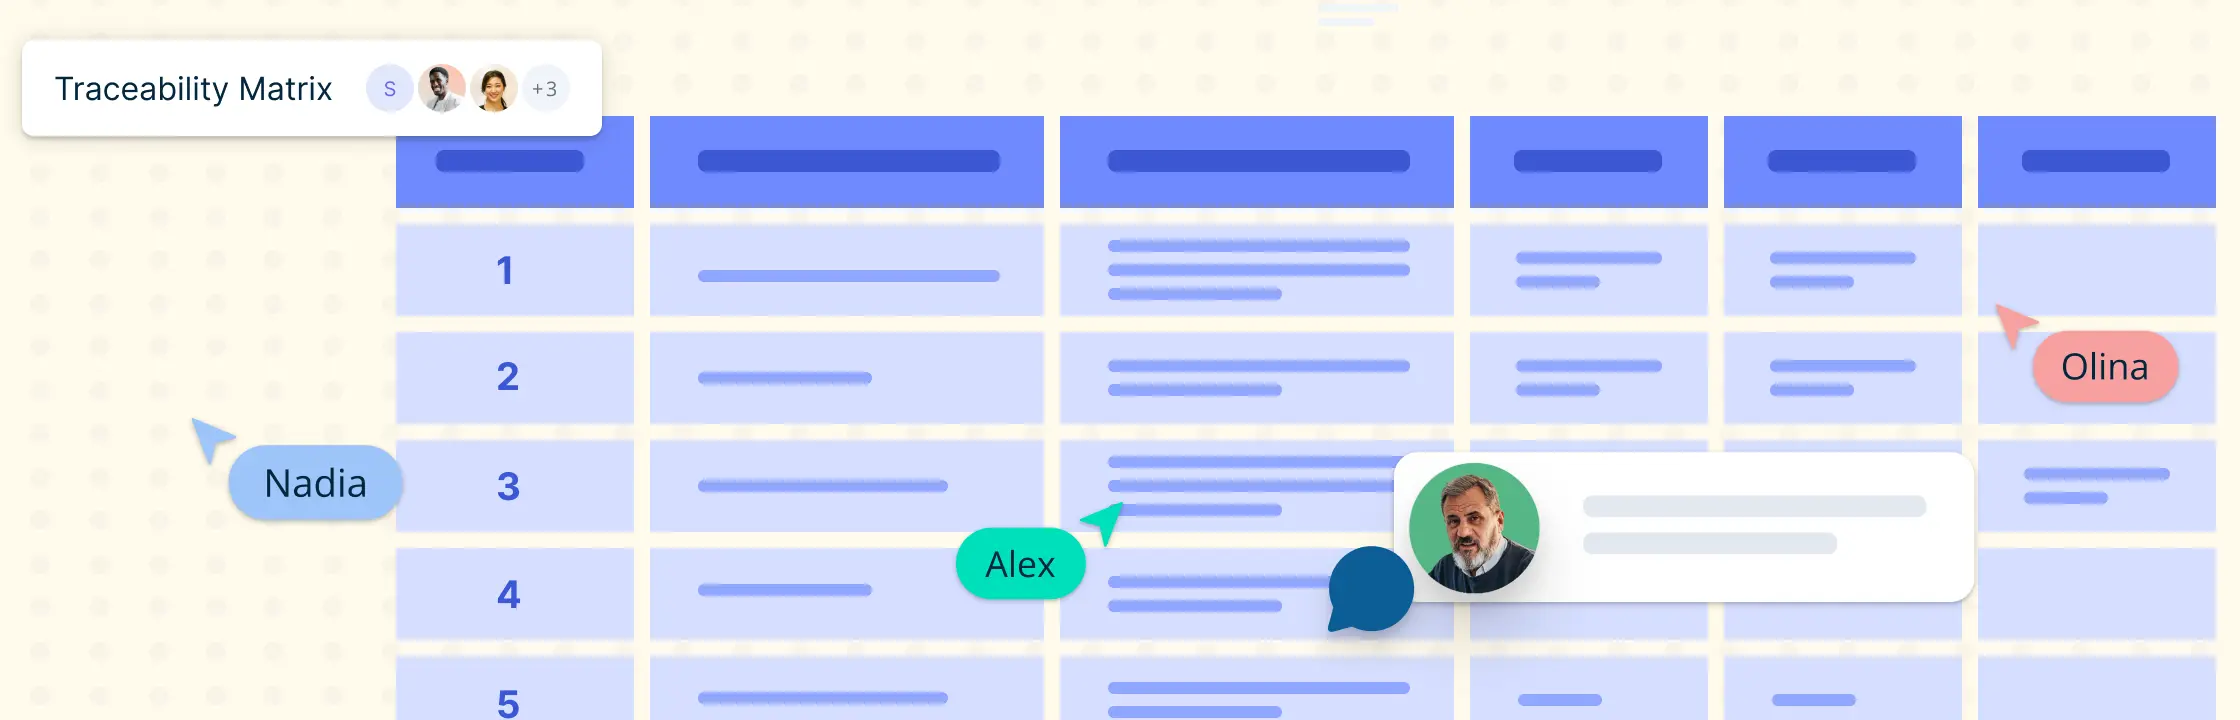
In this blog post, we delve into what an RTM is, how to create one and how it helps run projects successfully.