Free Org Chart Creator
Create Org Charts in Minutes
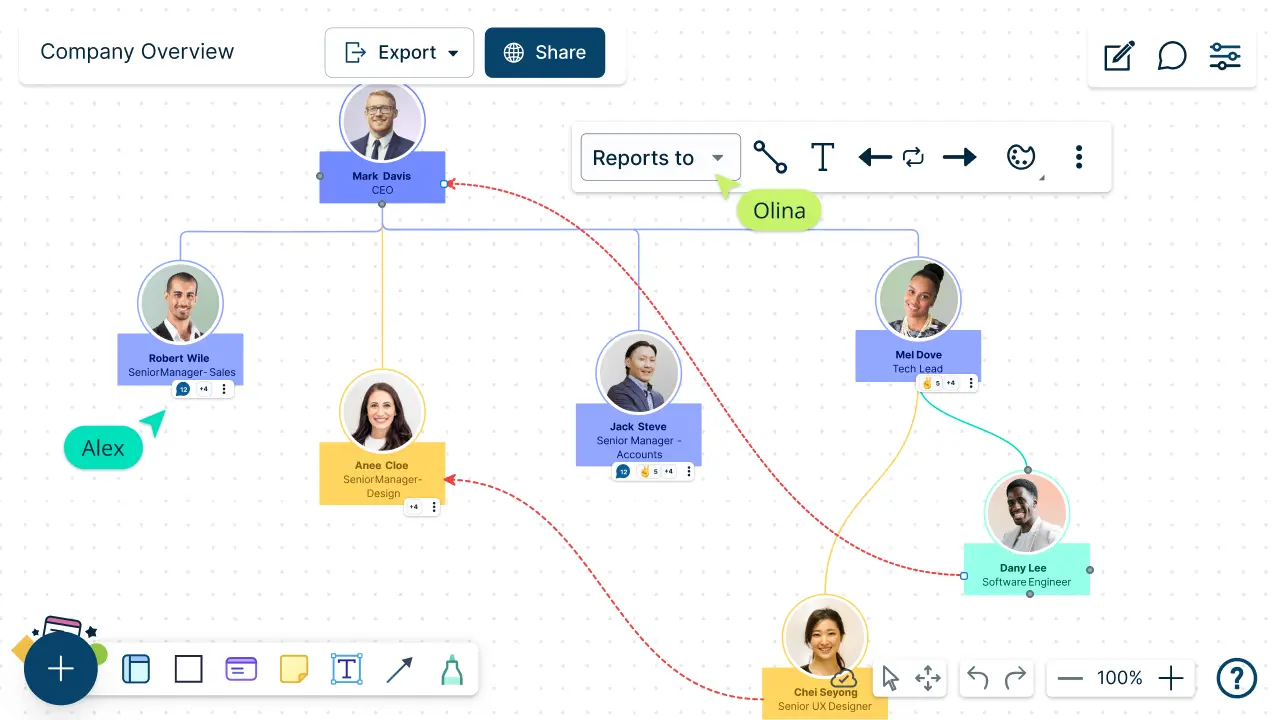
Design, manage, and share your organizational structure with Creately’s org chart software.
Visualize roles, responsibilities, and relationships within your organization with ease.
- Multiple free organizational chart templates to design team structures
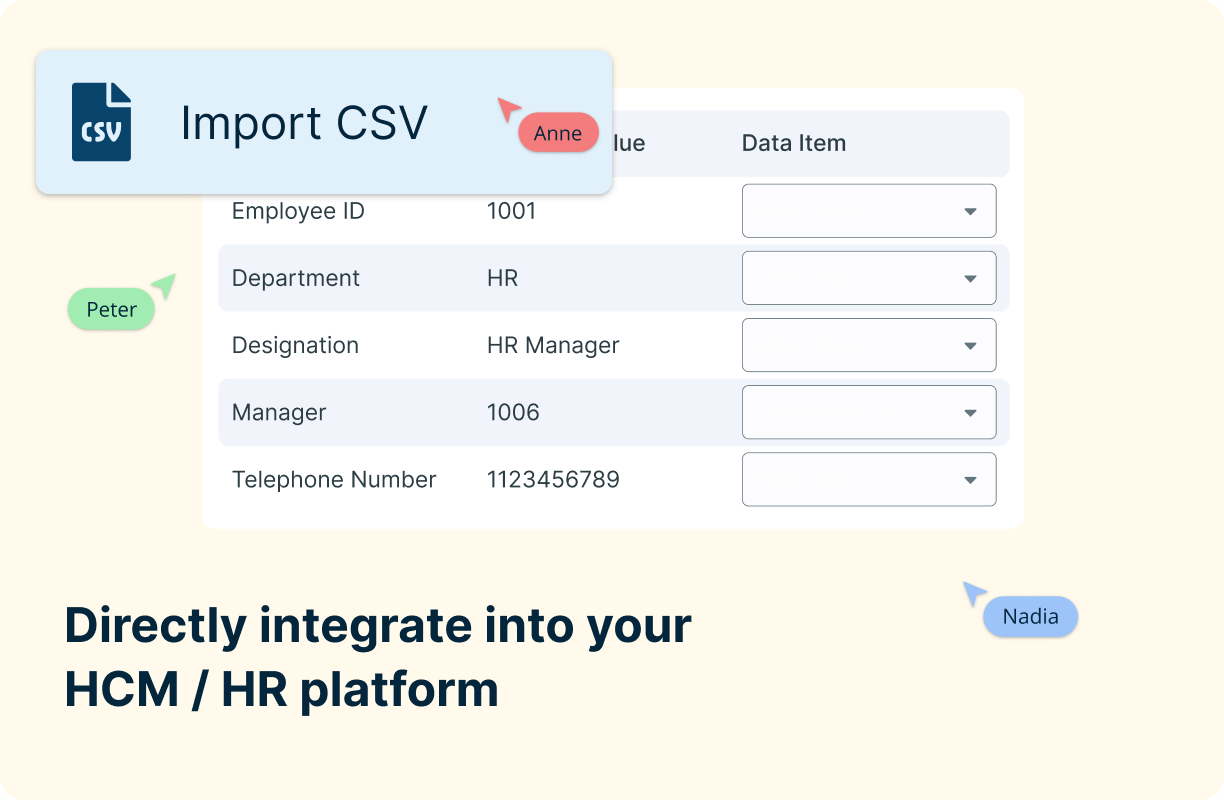
- Automatically generate org charts from CSV files, Google Sheets, and Excel files
- Collaborate in real-time with teams anywhere using our org chart creator
Over 10 Million people and 1000s of teams already use Creately

Automatically Create Org Charts with the Org Chart Generator
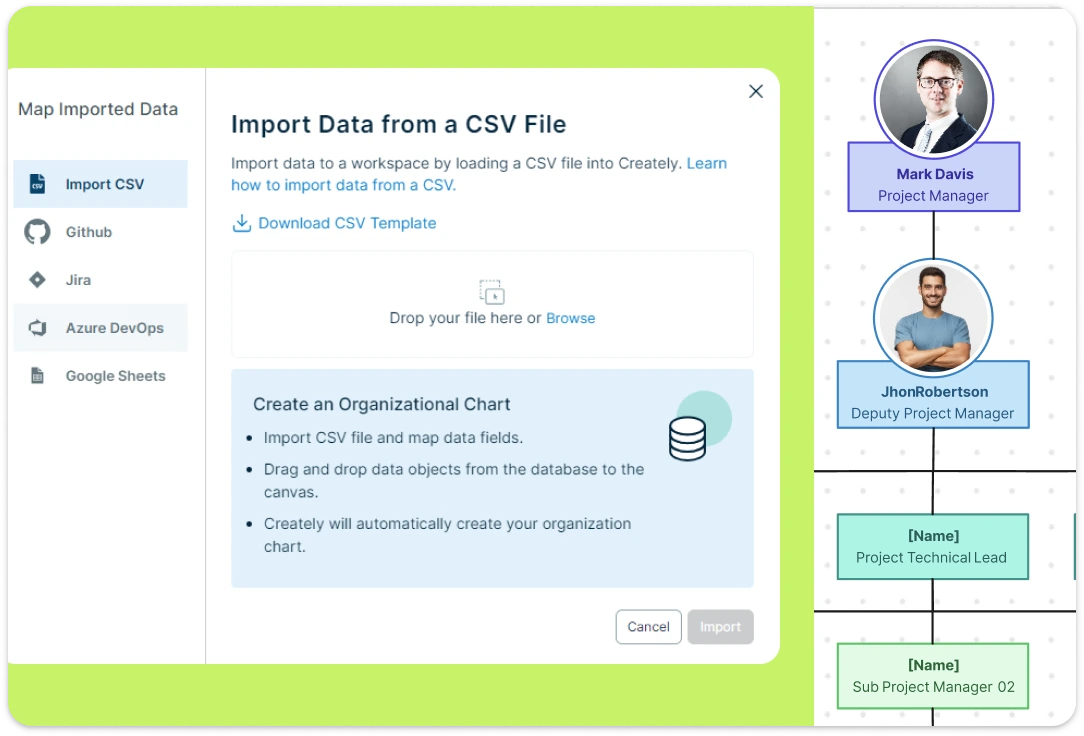

- Import org chart data from your HCM or as a CSV/Excel to map out org structures instantly.
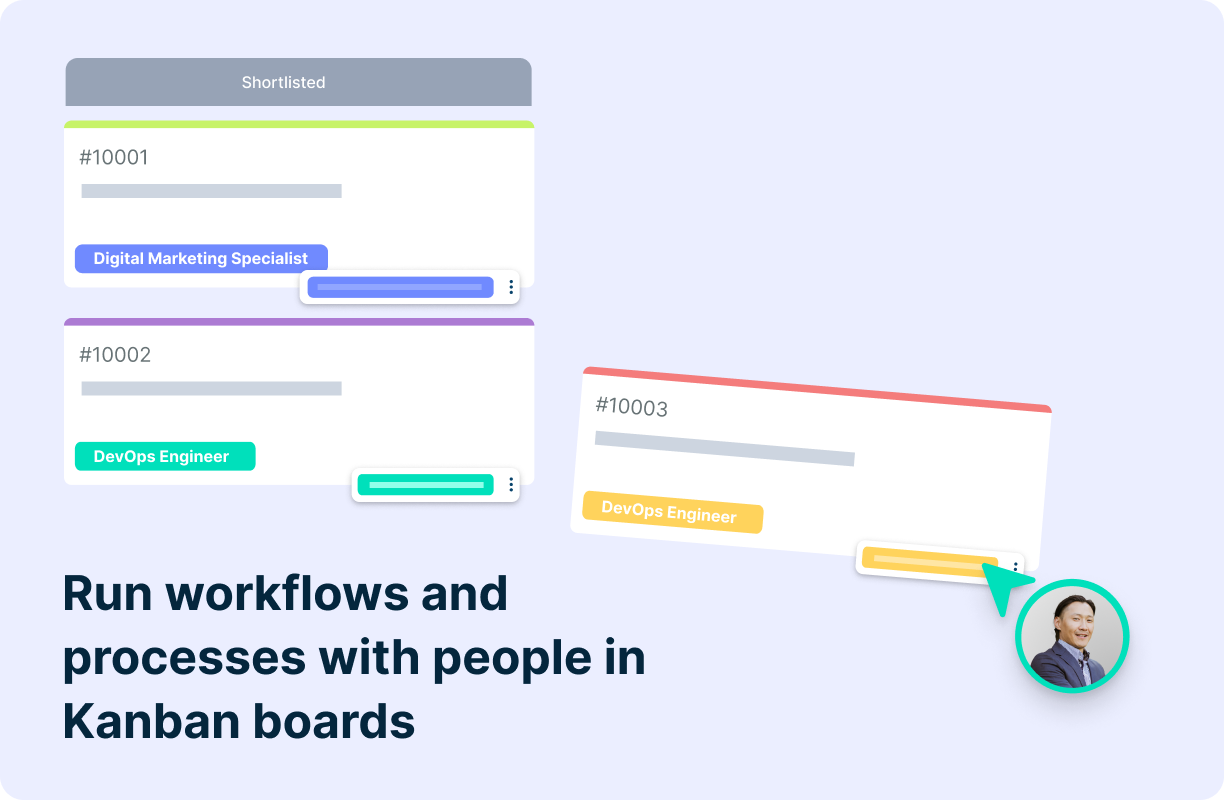
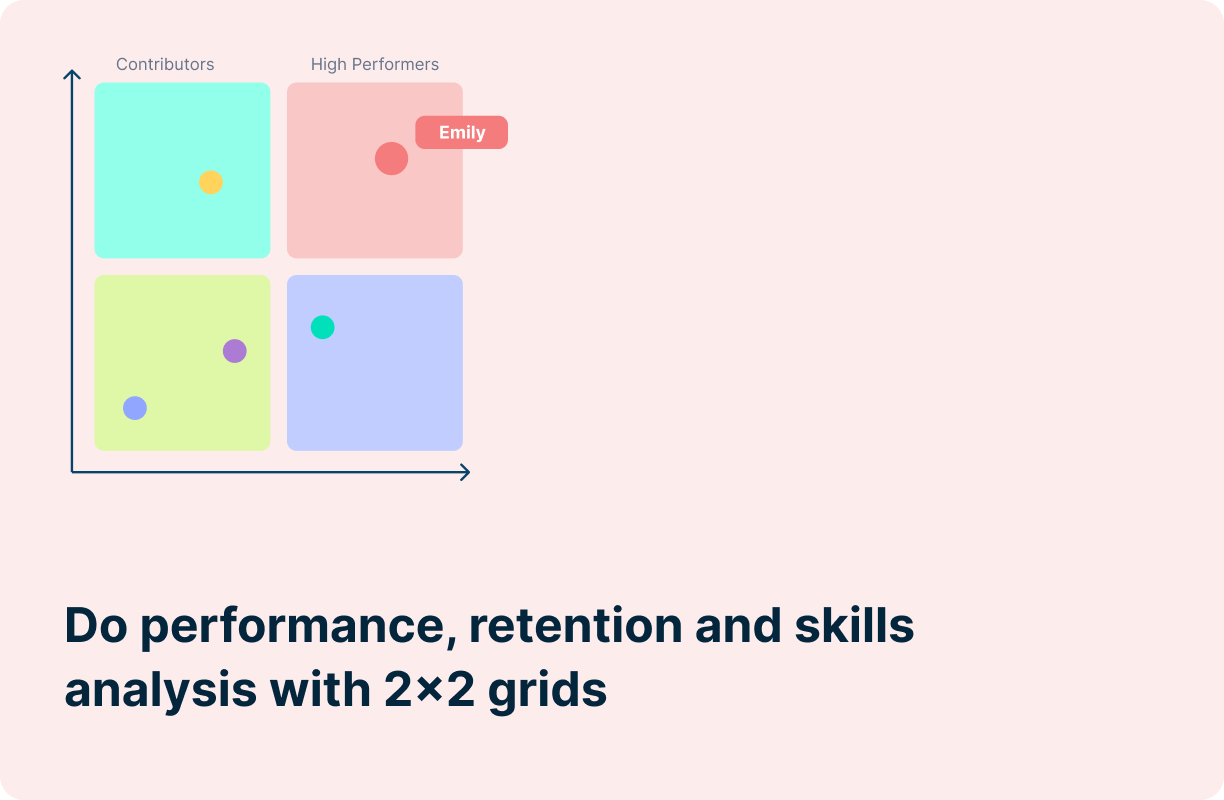
- Build org charts based on Department, Experience levels, Designations, performance & more.
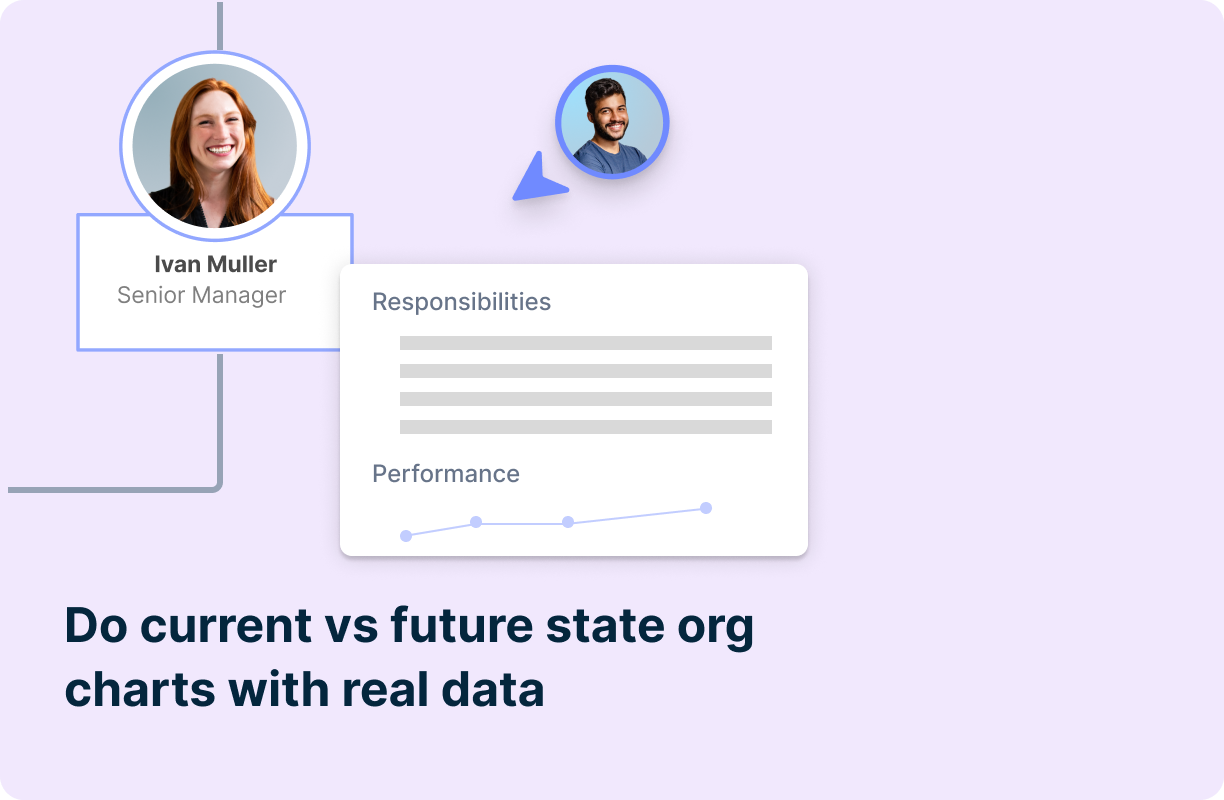
- Dynamic org chart views that auto-update whenever the central data changes.
- Show and filter additional data on the org charts as needed and run conditional formatting to highlight people based on data using Creately’s org chart generator.


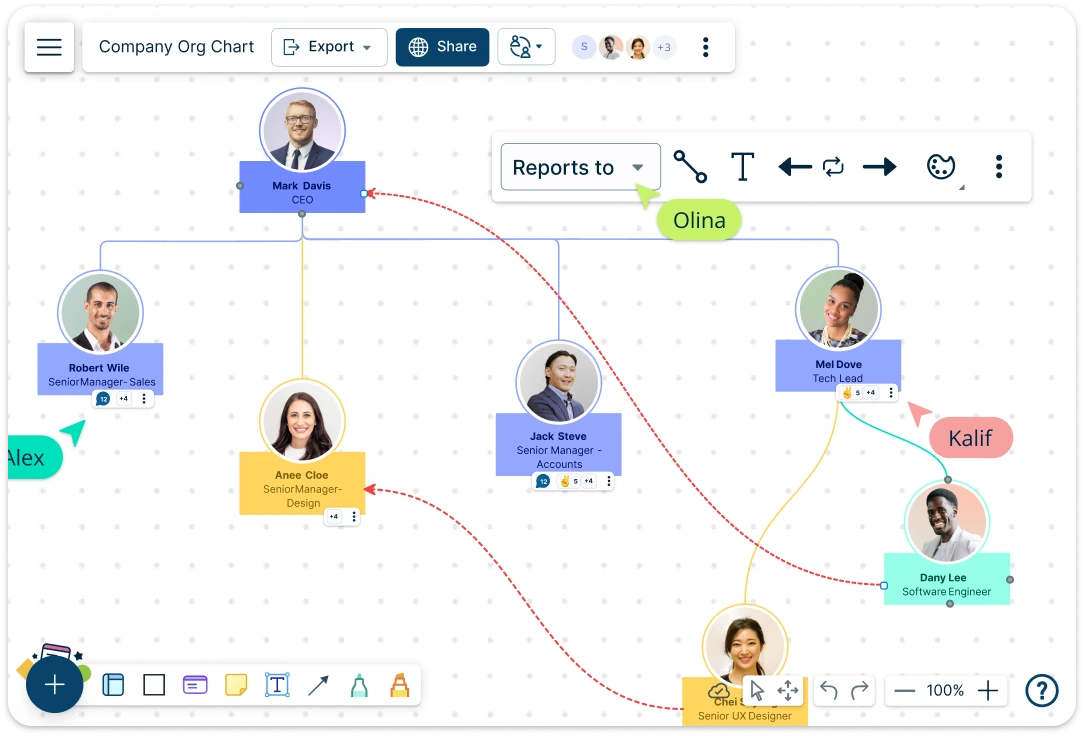
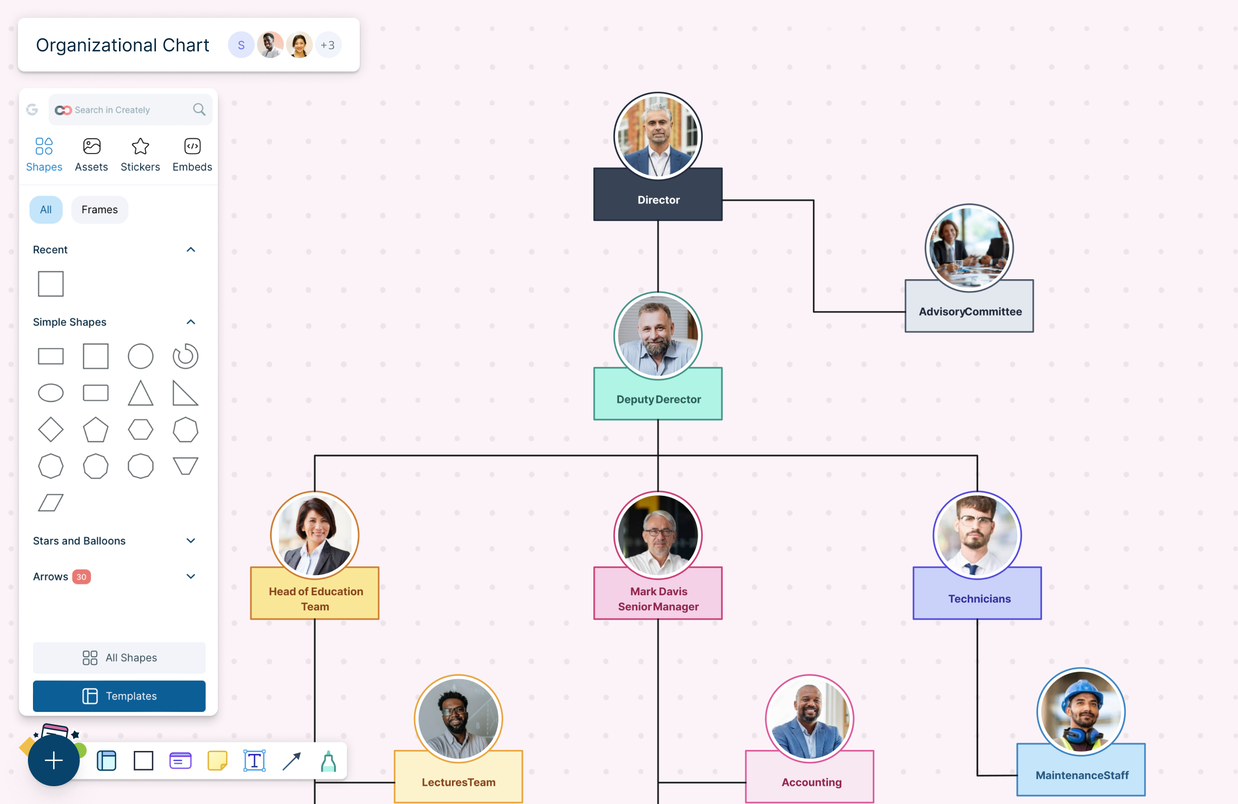
Design and Perfect Organizational Charts


- Get a head start with free premade org chart templates.
- Visualize large, complex org charts on Creately’s infinite canvas.
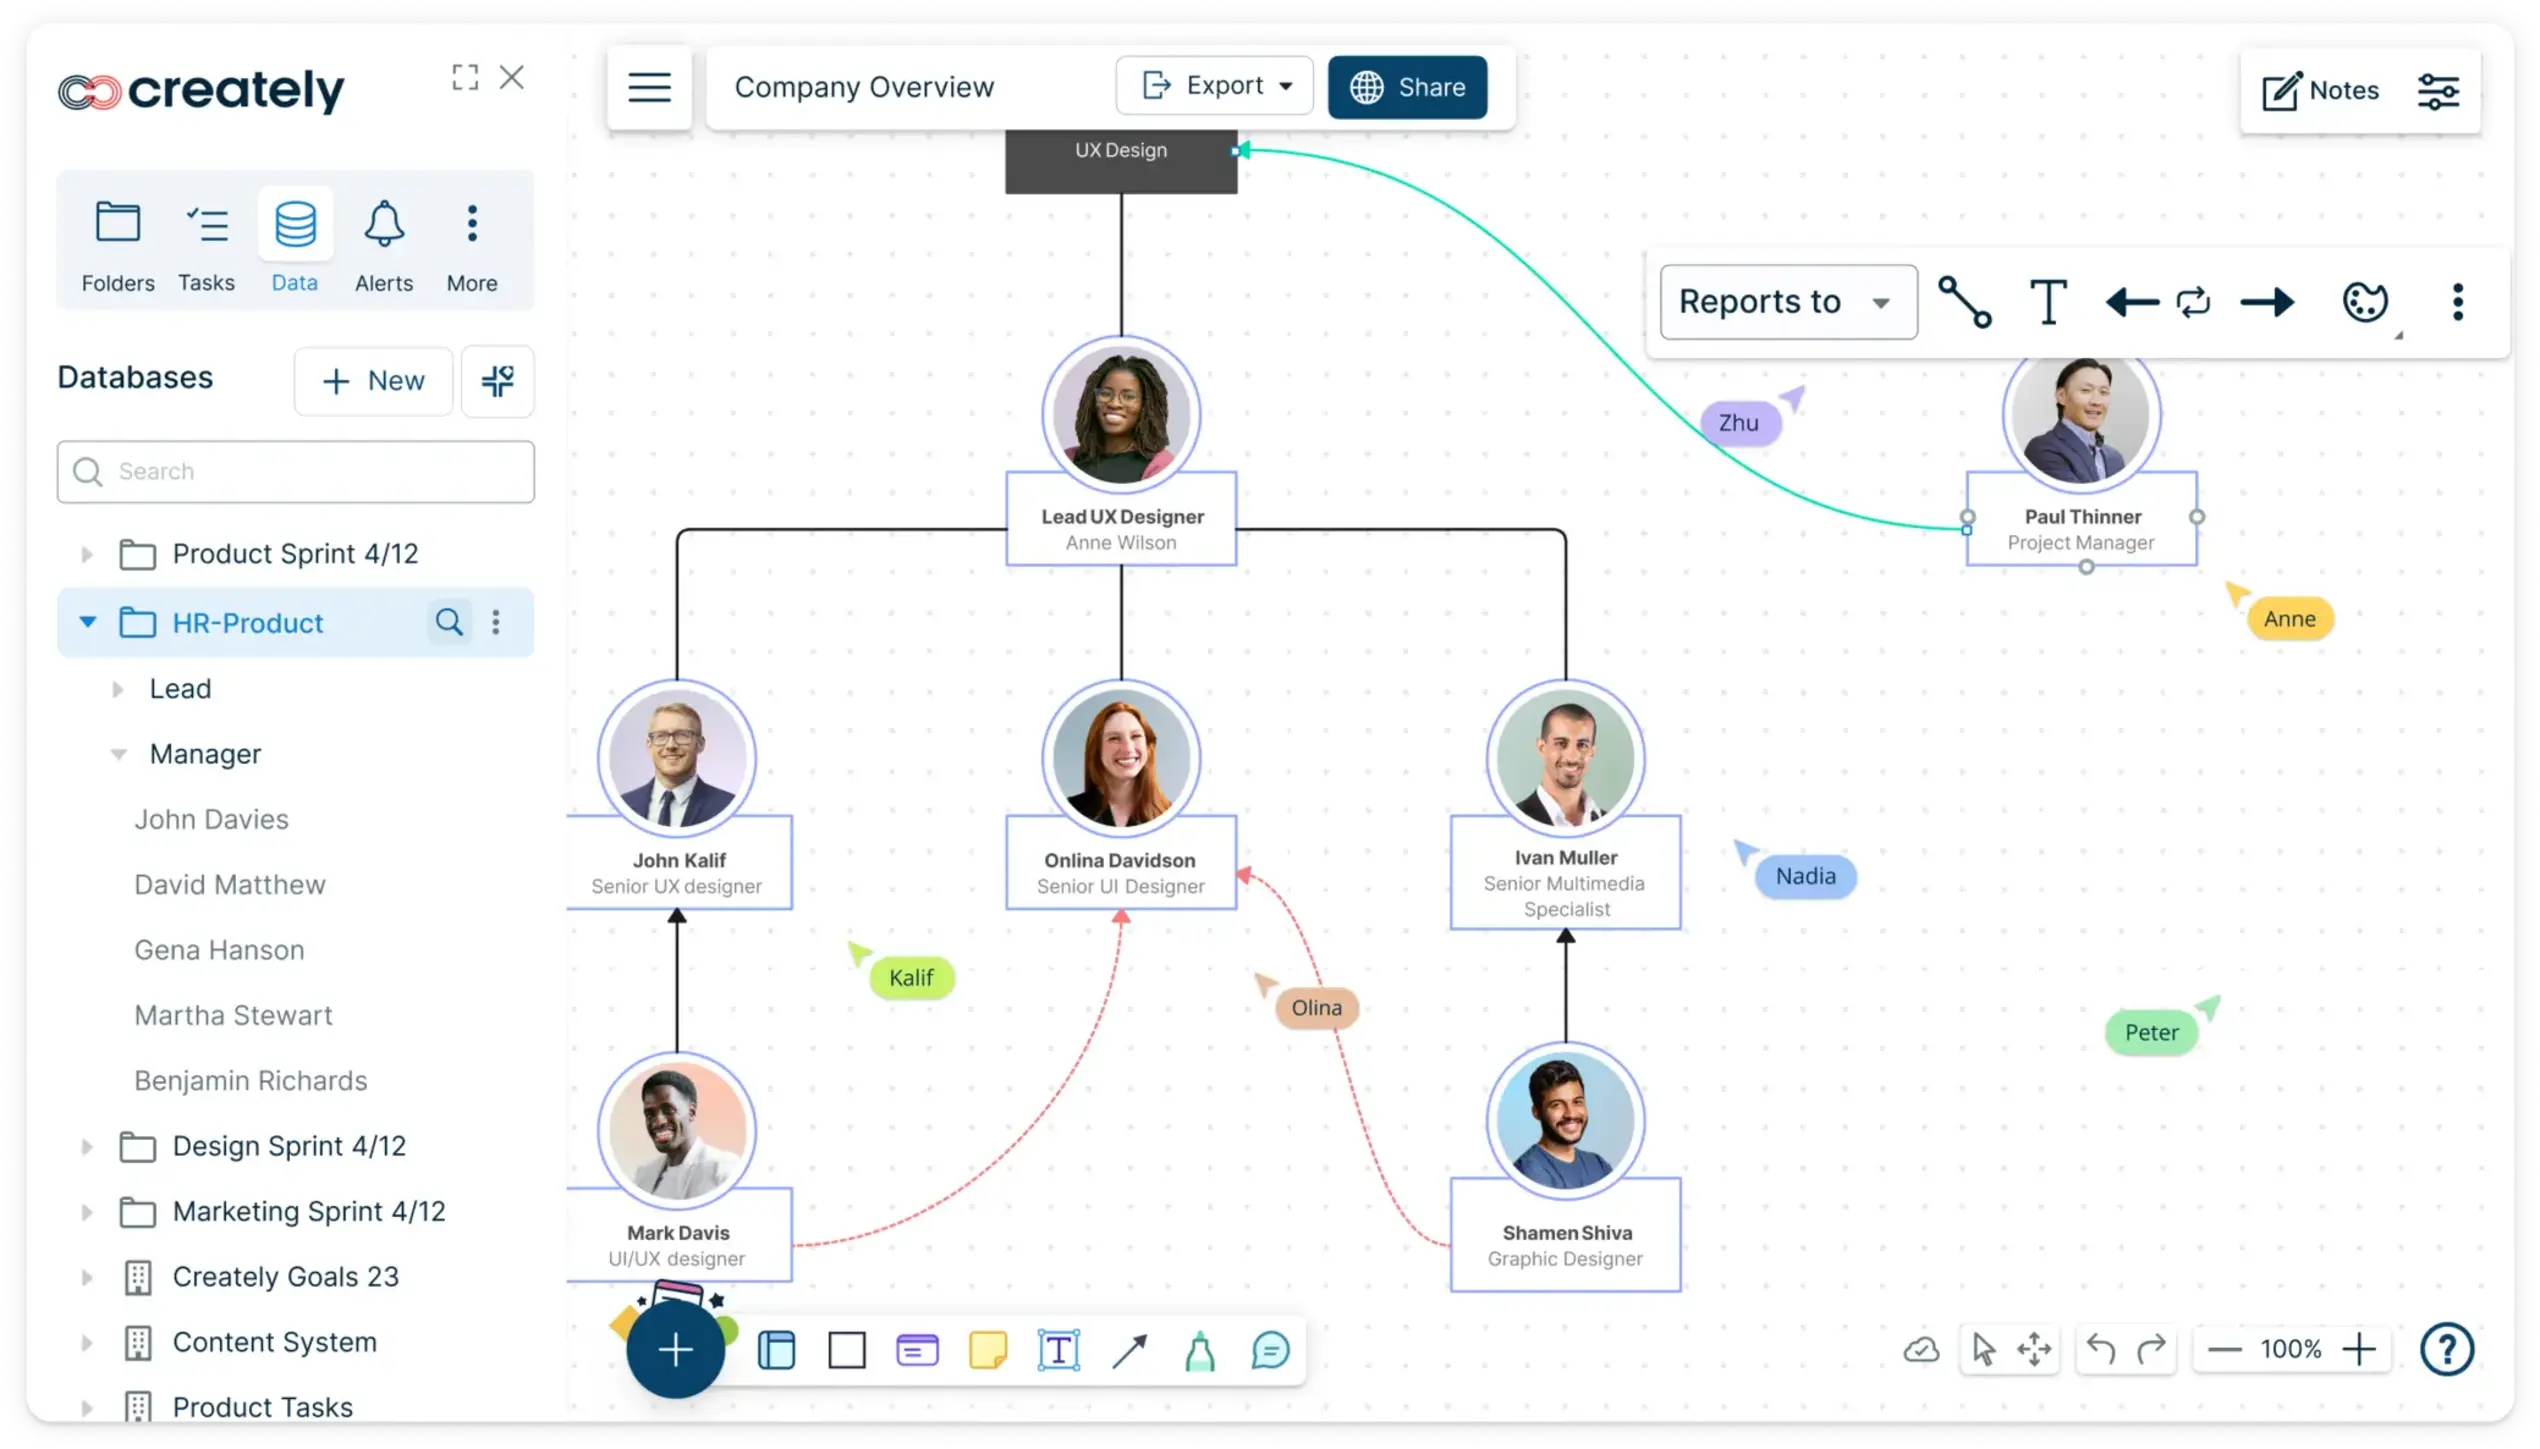
- Drag and drop employee images from your device or inbuilt Google image search.
- Highlight reporting relationships & levels of management with custom color themes.
Centralized Data Management for Your Organizational Chart
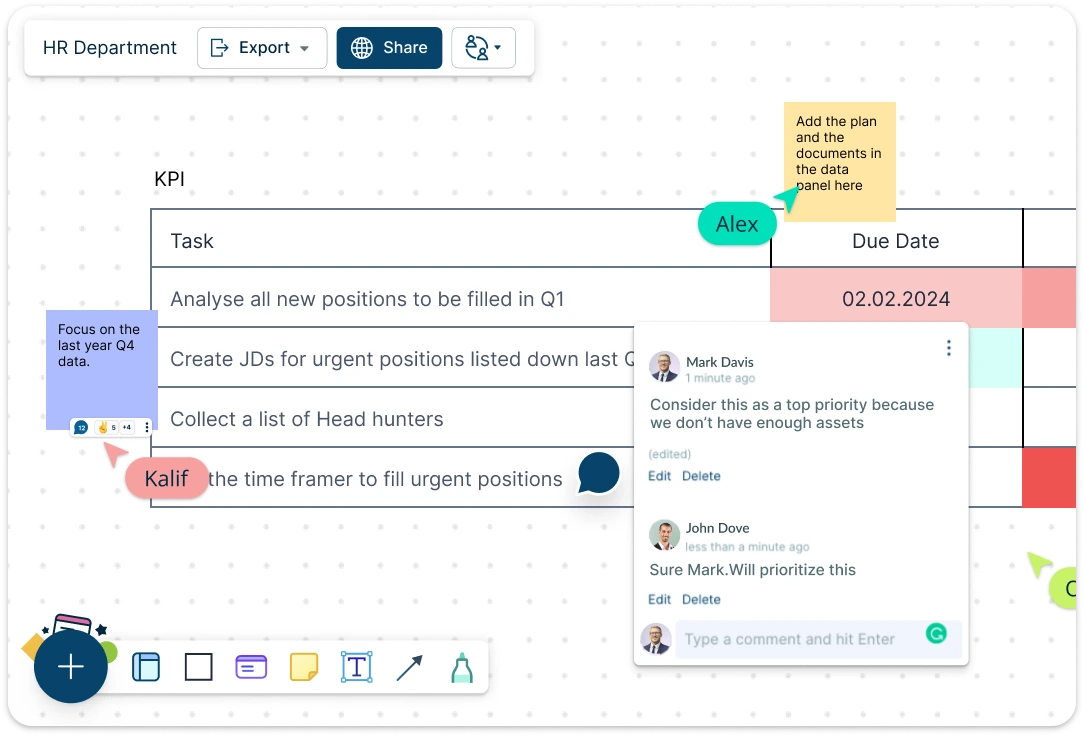
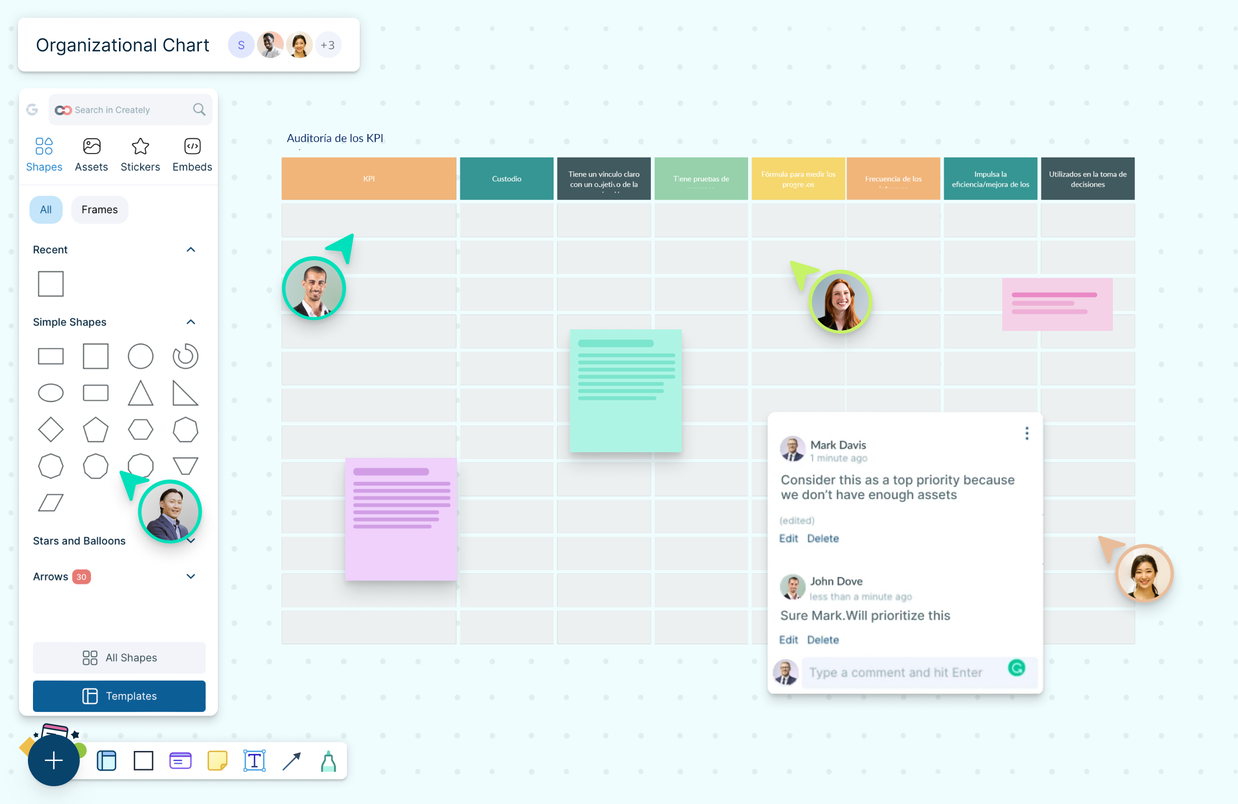
- Visualize OKRs, connect them to KPIs and co-ordinate efforts better with the org chart creator.
- Capture personal summaries, goal trees, 1:1 meeting notes in the org chart database inside Creately.
- Each person shape in Creately is linked to the same data, so wherever you make changes, it syncs to every other location.
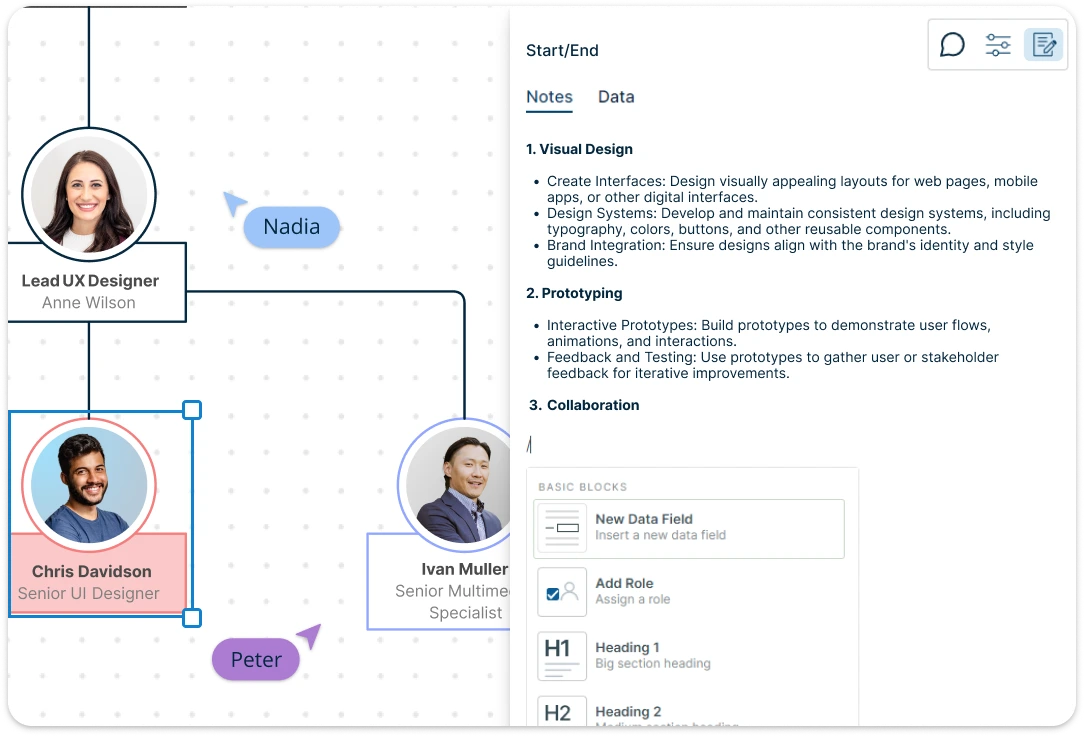
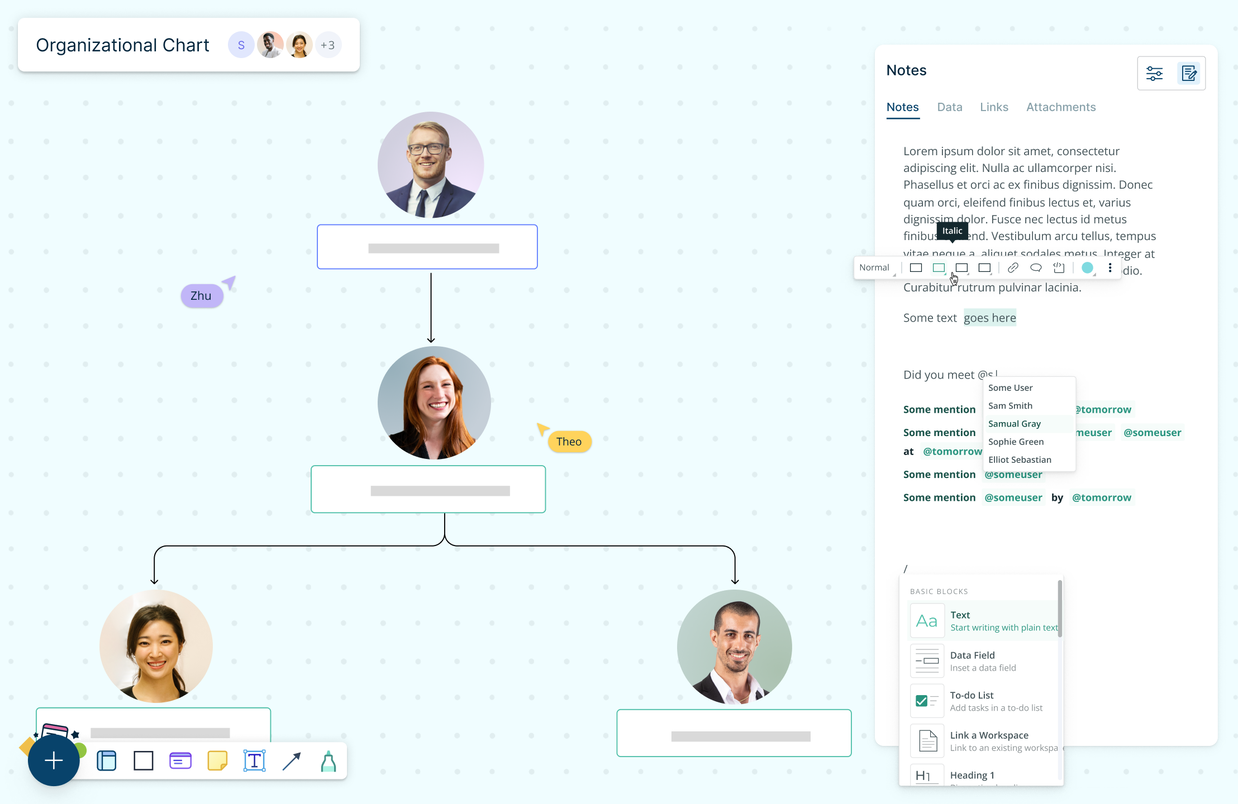
- Add notes, additional data, and attachments to any person on your organizational chart to keep everything in the same place.


An Online Org Chart Maker to Streamline Collaboration


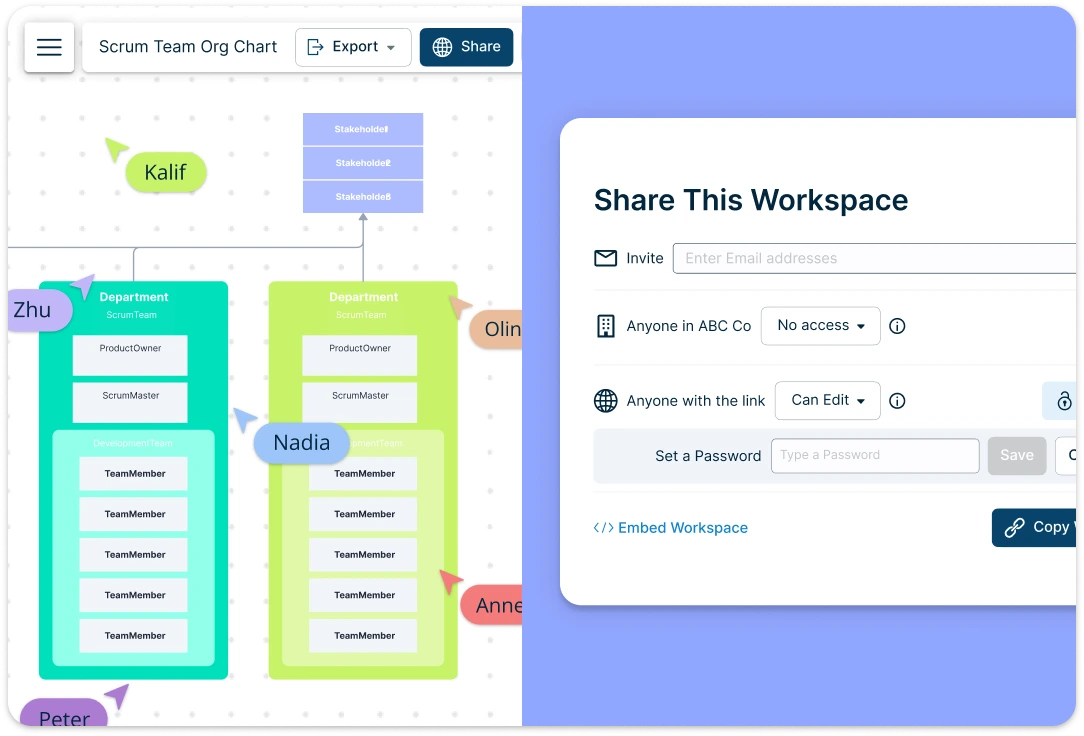
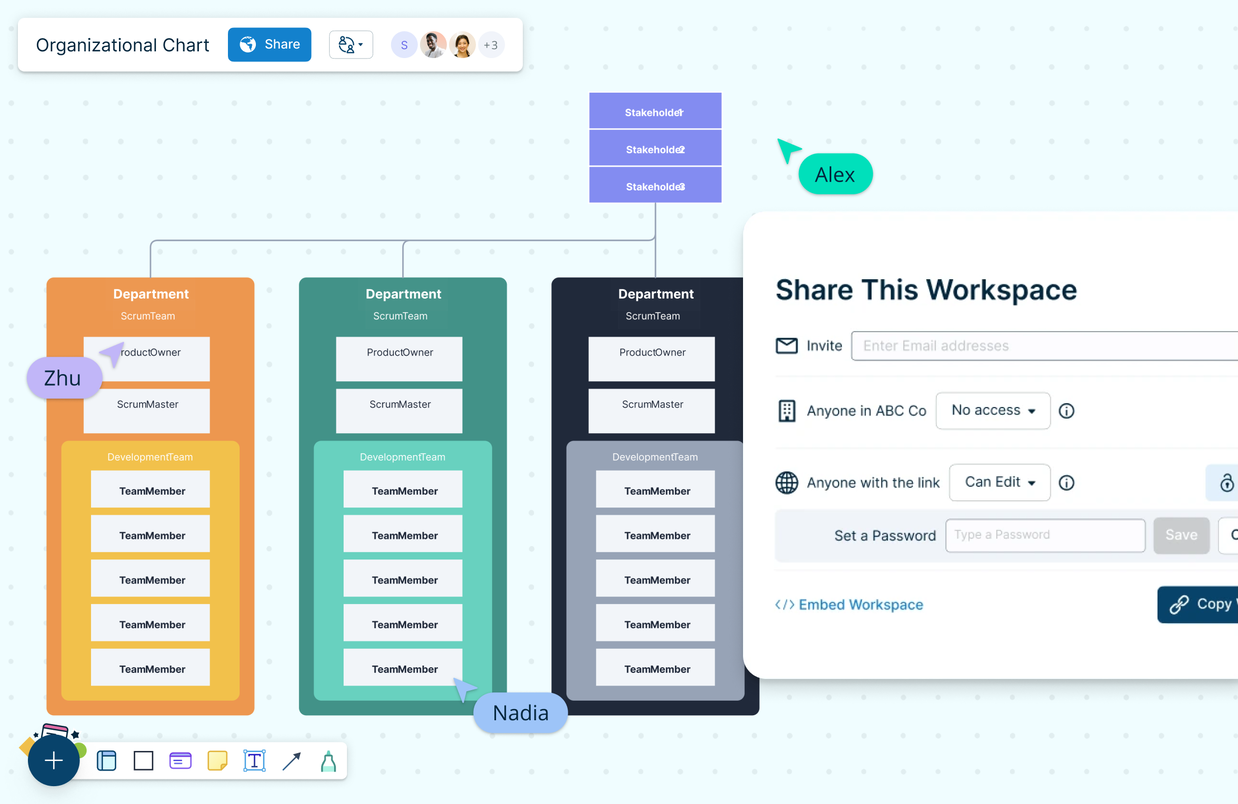
- A shared workspace to collaborate in real-time on making collective decisions.
- Fine-grained access control to ensure only those with access can see the relevant data fields.
- Export org charts in multiple formats to embed in documents & share across platforms.
- Add context to conversations with pinpointed comments and live cursor views.
Adapts to Your Ways of Working
- Flexibility to change anything manually as you prefer as your team grows & personnel changes.
- Present sections of org charts or plans with the in-build Slides features.
- Generate living org chart views that get auto-updated based on your own search criteria.
- Enable central notes and comments beyond what your HRIS/HCM platform offers and keep it central.


Powerful Data Driven Organizational Charts
Go Beyond Organizational Charts with Your HR Database
Brief History of Organizational Charts
The organizational chart was first introduced in the mid-19th century when Daniel McCallum created a diagram for a railroad company to show how it was organized. As businesses grew larger in the early 20th century, these charts became more important for showing who reports to whom and how different parts of the company fit together. Management experts like Frederick Taylor helped spread the use of these charts as businesses aimed to be more efficient.
Over time, organizational charts became standard tools for helping companies plan and communicate their structures clearly. Today, they’re used by many organizations to see and understand their internal setup.
What is an Org Chart Creator?
An org chart creator is a tool designed to help you visualize and map out the structure of your organization. It allows you to create diagrams that clearly show who is in charge, how roles are connected, and who reports to whom. With an org chart creator, you can easily customize charts to reflect your organization’s unique hierarchy, whether it’s a small team or a large enterprise. It’s an essential tool for understanding team dynamics, improving communication, and ensuring everyone knows their responsibilities. Whether you’re updating an existing structure or building one from scratch, an org chart creator simplifies the process, making it easy to create professional, clear, and accurate organizational charts in minutes.
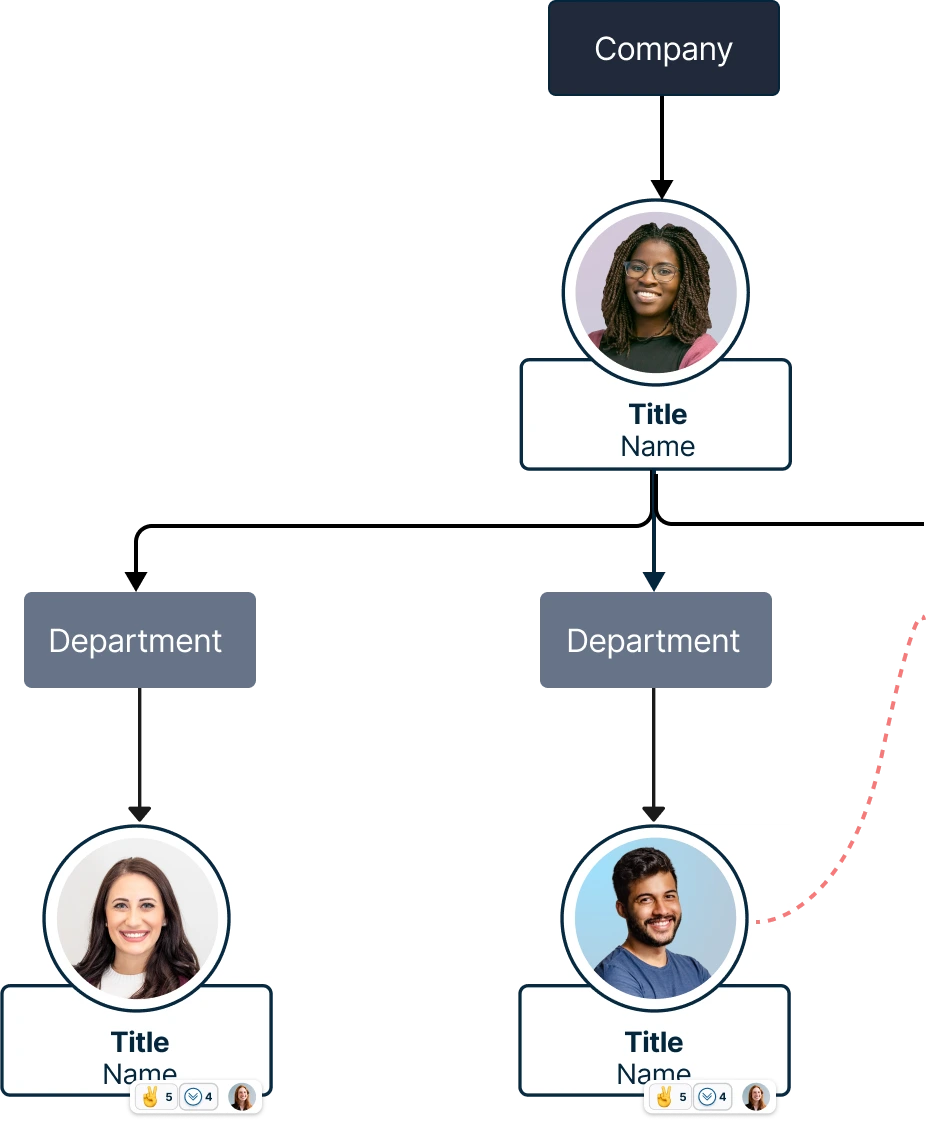
An organizational chart typically includes the following components:
- Positions/titles
Each box or shape represents a role or title within the organization, such as “CEO,” “Manager,” or “Team Leader.”
- Names
The names of the individuals holding each position are often listed within the boxes.
- Lines/connectors
Lines or arrows link the boxes to show the reporting relationships and how different roles are connected.
- Departments/teams
Groups or divisions within the organization might be shown to highlight different areas of responsibility.
- Authority levels
The chart displays different levels of authority, from top management to lower-level employees, illustrating the chain of command.
- Roles and responsibilities
Sometimes, a brief description of each role’s responsibilities may be included to clarify what each position entails.
- Additional information
Some charts might include extra details like contact information, key functions, or specific projects associated with each role.
Components of an Org Chart
Benefits of Org Charts
An organizational chart offers a clear view of a company’s structure, improving communication, management, and planning. It helps define roles, streamline workflows, and support better decision-making.
Limitations of Organizational Charts
While organizational charts are valuable for visualizing company structure, they come with certain limitations. Understanding these limitations helps in using org charts effectively while acknowledging their constraints.
- Static representation: Organizational charts provide a snapshot of the structure at a specific point in time, which can quickly become outdated as roles and relationships change.
- Lacks detail: They often simplify complex relationships and may not capture the nuances of day-to-day interactions, informal networks, or cross-functional teams.
- Limited flexibility: Org charts can be rigid and may not reflect dynamic aspects of the organization, such as project-based teams or temporary roles.
- Potential misinterpretations: The visual representation might not always convey the full scope of responsibilities or the actual workflow, leading to misunderstandings.
- Overemphasis on ranking: They focus on reporting relationships and may overlook collaborative and team-based work, which can be crucial for modern organizations.
- Difficulty in scalability: As organizations grow, maintaining and updating org charts can become cumbersome, especially in large or rapidly changing organizations.
Who Uses Organizational Charts
Organizational charts are used by various stakeholders within a company, including:
- Managers and executives
To oversee team structures, manage workflows, and ensure clear reporting lines.
- HR professionals
For planning and organizing staffing, understanding departmental structures, and facilitating recruitment.
- Employees
To understand their roles, reporting relationships, and how they fit into the overall organization.
- New hires
To quickly get acquainted with the company’s reporting relationships and key contacts.
- Business analysts
To analyze organizational structure for strategic planning or restructuring.
- Consultants
To evaluate organizational efficiency and recommend improvements.
How to Generate an Org Chart with Creately?
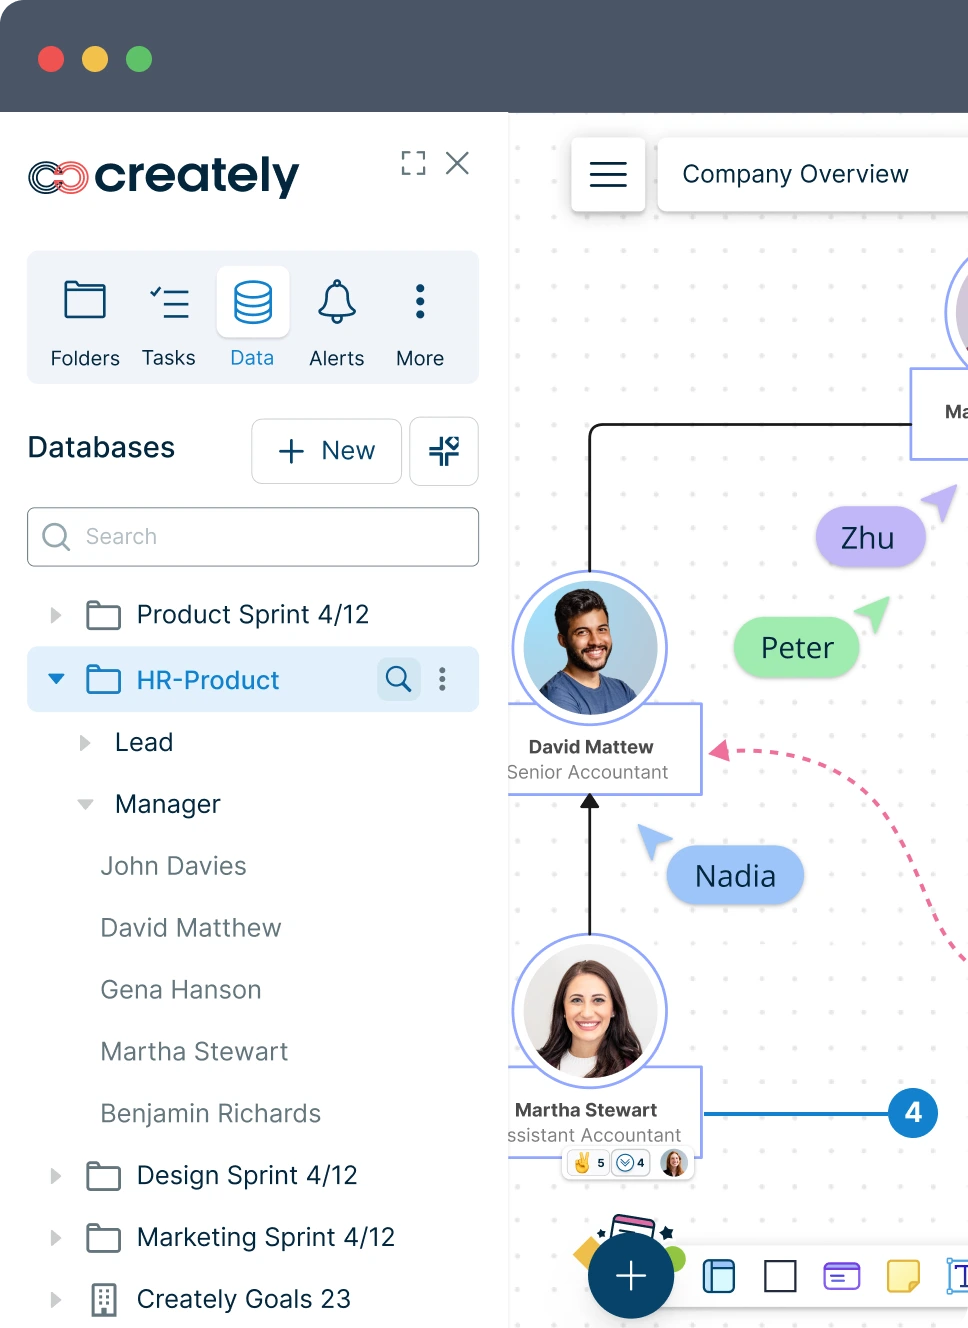
- Choose a template or start from scratch
Browse through pre-designed templates available in the org chart generator that suit your organization’s structure. Select a blank canvas if you prefer to build from the ground up. Consider industry-specific templates that may align with your needs
- Input employee data (names, titles, departments)
Manually enter information for each employee. Use bulk import features to add data from spreadsheets or HR systems. Ensure accuracy of titles and departmental assignments
- Define reporting relationships
Establish the authority by connecting positions. Use drag-and-drop functionality to arrange reporting lines. Clearly indicate direct reports and dotted-line relationships
- Customize the design (colors, shapes, layout)
Apply color schemes that match your brand or differentiate departments. Choose appropriate shapes for different levels of management. Adjust the layout to best represent your organizational structure (e.g., vertical, horizontal, matrix)
- Add additional information (contact details, photos)
Include employee photos to make the chart more personal and recognizable. Add contact information like email addresses or phone extensions. Incorporate role descriptions or key responsibilities
- Review and adjust the automatically generated chart
Check for accuracy in reporting lines and placement. Ensure readability and proper spacing between elements. Make manual adjustments to improve visual clarity if needed
- Share or export the final product
Generate shareable links for team collaboration. With Creately’s org chart software you can export your org charts in various formats (PNG, PDF, SVG) for different use cases. Set up permissions for viewing or editing the chart
FAQs About Org Chart Generator
What to look for in an org chart software?
An org chart software is a tool that streamlines the process of creating organizational charts online. These tools offers a variety of ways to design org charts. And some of the key capabilities an org chart software must have,
- Premade templates for organizational charts
- Standard shapes and connectors to create the chart
- Customization capabilities including color themes and uploading images
- Ability to migrate and attach employee data to the charts
- Options to easily share, embed or publish the chart

